

What happens when bond markets become the main driver of investor sentiment? In this edition of the InvestNow Market Wrap-Up, Alistair Dring, Assistant Portfolio Manager, Mint Diversified Funds at Mint Asset Management, examines the events that shaped July and the signals emerging from global markets.
Blame it on the bonds
If you watched only one number in July, it should have been that of the long-dated bond. Government bond yields are where the discount rate gets set, and the present value of every other asset flows from there. The US 30-year Treasury yield is an anchor for long-term borrowing costs worldwide and in July, it rose from 4.95% to 5.27%, the highest level since 2007. Where the US Treasury goes, the rest of the world tends to follow, so long-dated yields lifted alongside it across most other developed markets. While the back-end did some heavy yield lifting, the front end also experienced a pick-up.
The primary factor for the repricing of yields is interesting. First, and not unexpectedly, given the fitful nature of the conflict in Iran and its impact on the oil price, inflation expectations drifted higher. In addition, the US Federal Reserve held rates for a fifth consecutive meeting on 29 July, at a time when its own June projections showed half the committee leaning toward a further hike this year. Markets read the hold not as confidence, but as a central bank content to wait while inflation stayed above target. This prompted markets to be concerned about intransigent inflation getting moored in expectations.
Another reason for the pick-up in bond yields is a little more tenuous. Many pundits are pointing to increased competition from AI-related issuers competing for the same buyers. Governments heavy debt issuance now has company. The largest AI and cloud companies have raised roughly US$225 billion in bonds so far this year to fund data-centre construction, a pace that puts them on track for around US$400 billion. Investor appetite is visibly thinning: orders for those deals covered nearly five times the amount on offer in February, and less than twice by July. Many argue this is not a reason for higher yields and that it is difficult to squeeze out government issuers, but more bonds chasing the same pool of savings does not make yields go lower.
And finally, the sound of silence. All of this was not helped by the Fed who stopped telling markets what it was thinking. New chair Kevin Warsh has abolished forward guidance outright – the July policy statement ran to 132 words, against 341 in April. Whatever the long-run merits of that change, its immediate effect is that investors must price the future themselves, and uncertainty about the path of short-term rates gets paid for at the long end of the curve.
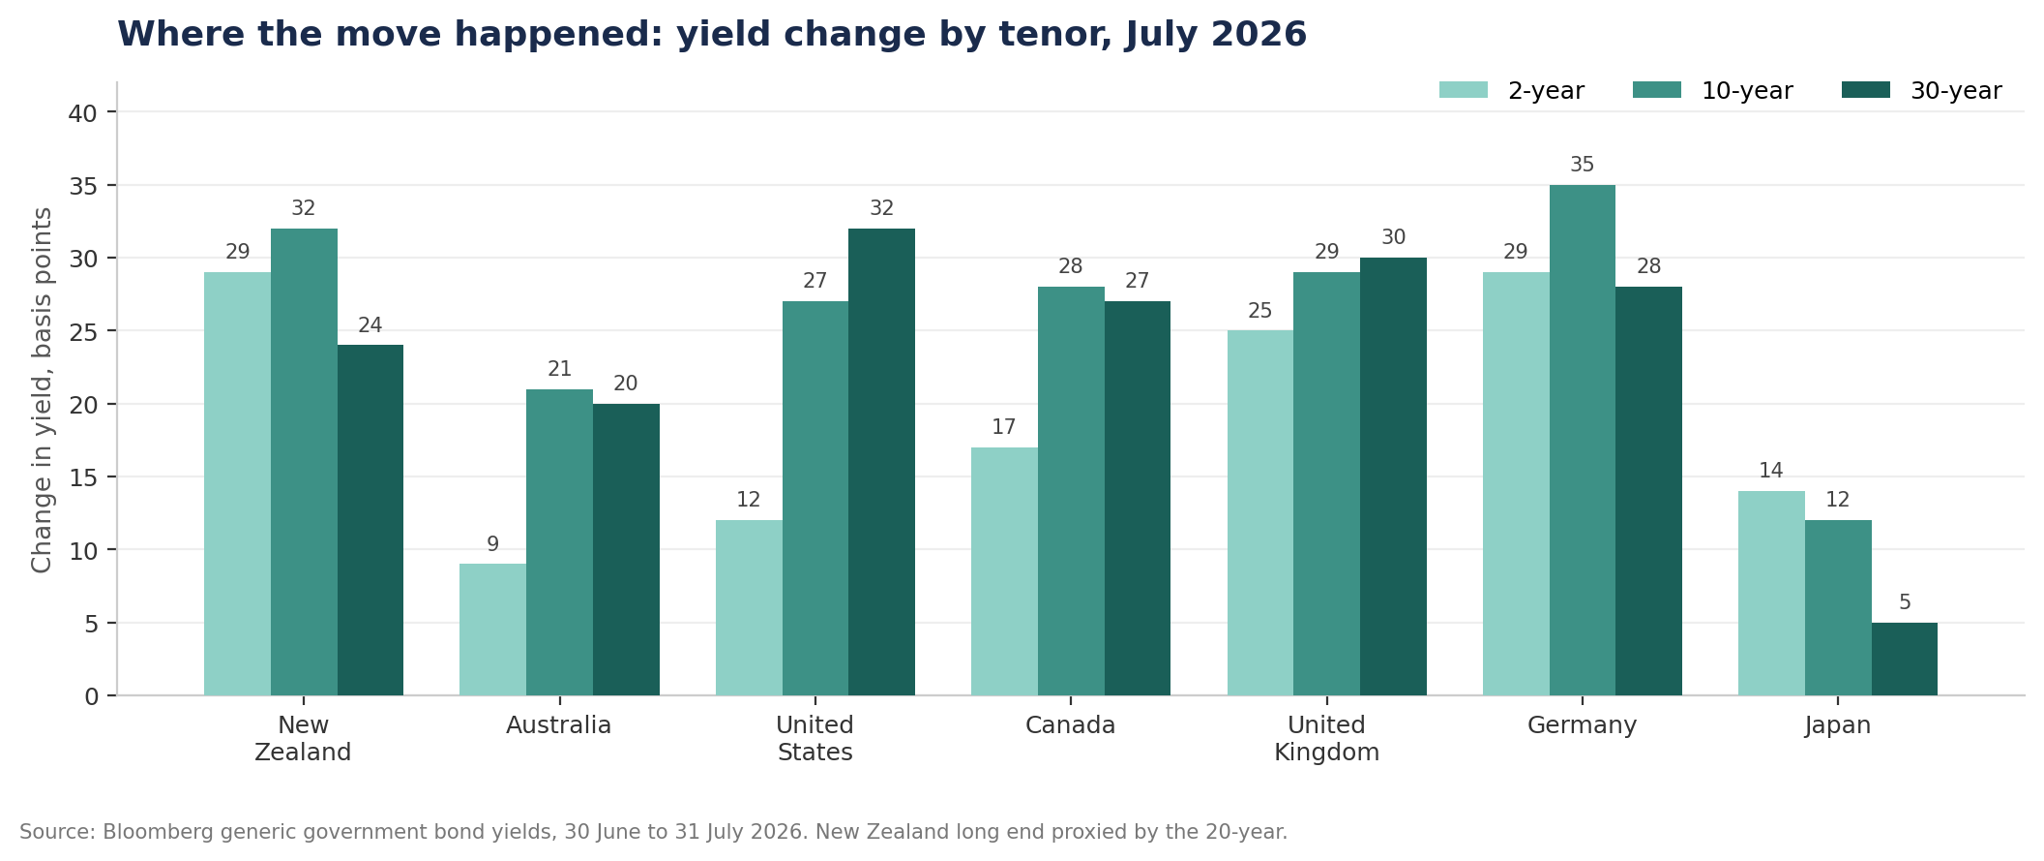
While rates across the major economies rose, the movements across the yield curves of different countries does tell a more distinct story. In the US, thirty-year yields rose further than ten-year yields, widening the gap between the two by 15 basis points. But, in Germany, Japan and New Zealand the middle of the curve led instead, and in Japan two-year yields rose faster than ten-year ones. For Japan, that reflects the market repricing interest rates expectations over the coming years.
Yield moves within New Zealand
New Zealand’s version of the move was policy driven. The Reserve Bank raised the Official Cash Rate to 2.50% on 8 July, ahead of most forecasts, and annual inflation then printed at 4.1% – above the Bank’s own 3.9% estimate and a two-year high. This presents a real pain for the RBNZ. Rather than settling the question of whether tightening was finished, that combination reopened the question. The local ten-year yield rose 31 basis points and the two-year 29, close to a parallel shift across the curve.
Across the Tasman, Australia’s two-year moved just 9 basis points as the RBA sat still. Twenty basis points of divergence at the short end, between two neighbouring economies in a single month, is a fair measure of how differently the two central banks are reading their own inflation problems.
The bonds drive and the equities follow
Duration is a bond idea, but it applies just as well to shares. Imagine a company that won’t turn a profit for many years. That’s like a long-term bond. If money is cheap and interest rates are low, it looks attractive. But the moment rates climb, it becomes vulnerable. A company earning steady cash today behaves like a short-dated one. When discount rates rise, the first group is marked down more.
That is what happened across the AI and semiconductor complex in July. The businesses themselves did not deteriorate. Earnings forecasts for many of them were revised higher during the very month their share prices fell. What changed was the discount rate applied to profits sitting years out. The pressure was not limited to the obvious names, either. Any company with its earnings weighted toward the future felt it, including in sectors where nothing had changed operationally at all.
The other side of that trade was a rotation into companies earning cash now. The gap between value and growth returns was, on some measures, the widest since 2003.
Look to spreads & breadth for signs of stress
We read July as a repricing, not something worse because of the reaction to higher yields in the credit market. Credit investors lend to companies and get paid a fixed return if all goes well, while losing capital if it does not. That lopsided payoff makes them constitutionally nervous, and they usually price bad news before equity investors do. However, through July, corporate credit spreads widened only modestly, and stayed well short of levels associated with genuine stress.
Market breadth held up too. Around 70% of companies in the S&P 500 remain above their 200-day average price, though July itself. This indicates more stocks are participating in the upside, but relative to the breadth indicator, fewer have moved positively month-to-month. The good news? Earnings didn’t disappoint.
Signal from the noise: the Mint 3x3x3 model
Sorting the signal from the noise is exactly what our 3x3x3 model is built to address. It is a proprietary framework that reads markets across three time horizons at once – tactical, business cycle and structural and weights them so that a noisy fortnight cannot drown out slower-moving signals. Each horizon draws on its own set of inputs, covering valuation, momentum, macroeconomic conditions and market internals, and each produces a reading on a scale from defensive to constructive. What emerges is one reading from the combined composites and an indication of risk position.
The purpose is discipline. Markets generate an enormous volume of information every day, most of which is noise, and the natural human response is to over-weight whatever happened most recently. A framework that forces us to look at the same question over three different timeframes makes that harder to do.
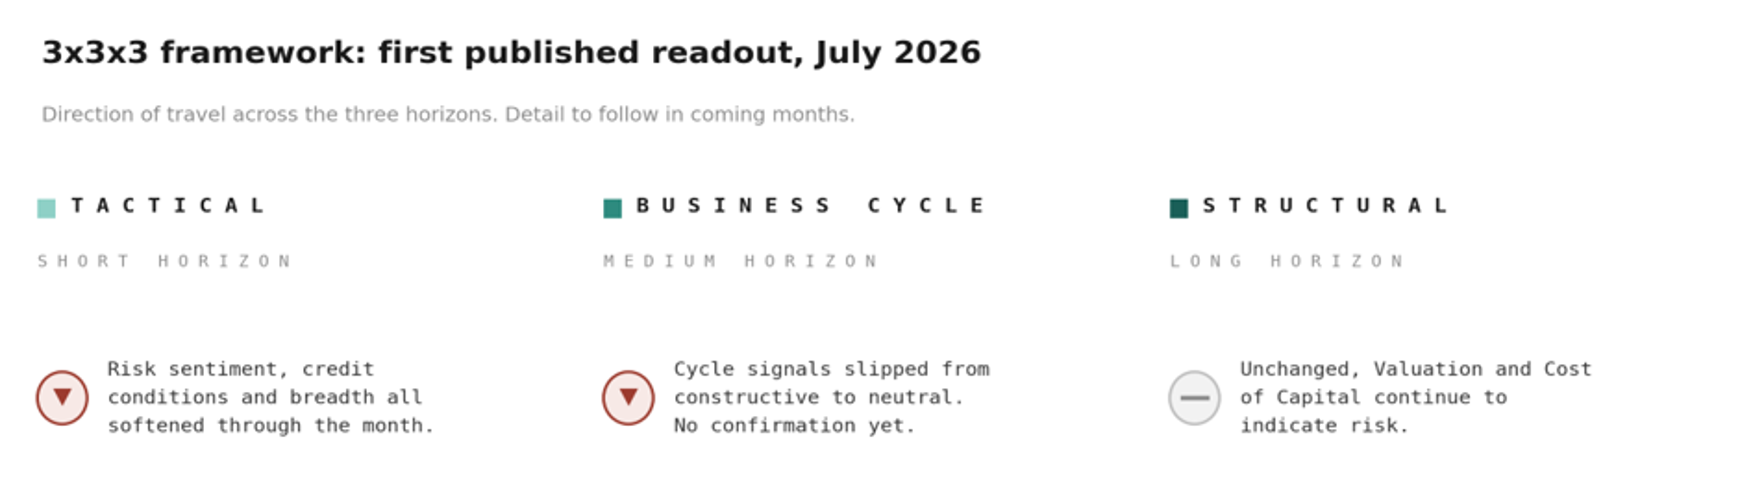
In July the two shorter term horizons moved toward caution while the structural reading remained unchanged. The composite now sits in cautious territory: nearer a defensive stance than it was at the start of the month, but short of the threshold at which the process would call for a discussion around defensive repositioning. The direction of travel is the more useful signal here, rather than the stand alone reading on any given day and ultimately our model is a guide – it informs our thinking but doesn’t replace it.
If you want to see which Mint funds are available on InvestNow, plus read any other opinion or commentary pieces from Alistair and the team at Mint, please visit their page on our website.

What happens when bond markets become the main driver of investor sentiment? In this edition of the InvestNow Market Wrap-Up, Alistair Dring, Assistant Portfolio Manager, Mint Diversified Funds at Mint Asset Management, examines the events that shaped July and the signals emerging from global markets.
Blame it on the bonds
If you watched only one number in July, it should have been that of the long-dated bond. Government bond yields are where the discount rate gets set, and the present value of every other asset flows from there. The US 30-year Treasury yield is an anchor for long-term borrowing costs worldwide and in July, it rose from 4.95% to 5.27%, the highest level since 2007. Where the US Treasury goes, the rest of the world tends to follow, so long-dated yields lifted alongside it across most other developed markets. While the back-end did some heavy yield lifting, the front end also experienced a pick-up.
The primary factor for the repricing of yields is interesting. First, and not unexpectedly, given the fitful nature of the conflict in Iran and its impact on the oil price, inflation expectations drifted higher. In addition, the US Federal Reserve held rates for a fifth consecutive meeting on 29 July, at a time when its own June projections showed half the committee leaning toward a further hike this year. Markets read the hold not as confidence, but as a central bank content to wait while inflation stayed above target. This prompted markets to be concerned about intransigent inflation getting moored in expectations.
Another reason for the pick-up in bond yields is a little more tenuous. Many pundits are pointing to increased competition from AI-related issuers competing for the same buyers. Governments heavy debt issuance now has company. The largest AI and cloud companies have raised roughly US$225 billion in bonds so far this year to fund data-centre construction, a pace that puts them on track for around US$400 billion. Investor appetite is visibly thinning: orders for those deals covered nearly five times the amount on offer in February, and less than twice by July. Many argue this is not a reason for higher yields and that it is difficult to squeeze out government issuers, but more bonds chasing the same pool of savings does not make yields go lower.
And finally, the sound of silence. All of this was not helped by the Fed who stopped telling markets what it was thinking. New chair Kevin Warsh has abolished forward guidance outright – the July policy statement ran to 132 words, against 341 in April. Whatever the long-run merits of that change, its immediate effect is that investors must price the future themselves, and uncertainty about the path of short-term rates gets paid for at the long end of the curve.
While rates across the major economies rose, the movements across the yield curves of different countries does tell a more distinct story. In the US, thirty-year yields rose further than ten-year yields, widening the gap between the two by 15 basis points. But, in Germany, Japan and New Zealand the middle of the curve led instead, and in Japan two-year yields rose faster than ten-year ones. For Japan, that reflects the market repricing interest rates expectations over the coming years.
Yield moves within New Zealand
New Zealand’s version of the move was policy driven. The Reserve Bank raised the Official Cash Rate to 2.50% on 8 July, ahead of most forecasts, and annual inflation then printed at 4.1% – above the Bank’s own 3.9% estimate and a two-year high. This presents a real pain for the RBNZ. Rather than settling the question of whether tightening was finished, that combination reopened the question. The local ten-year yield rose 31 basis points and the two-year 29, close to a parallel shift across the curve.
Across the Tasman, Australia’s two-year moved just 9 basis points as the RBA sat still. Twenty basis points of divergence at the short end, between two neighbouring economies in a single month, is a fair measure of how differently the two central banks are reading their own inflation problems.
The bonds drive and the equities follow
Duration is a bond idea, but it applies just as well to shares. Imagine a company that won’t turn a profit for many years. That’s like a long-term bond. If money is cheap and interest rates are low, it looks attractive. But the moment rates climb, it becomes vulnerable. A company earning steady cash today behaves like a short-dated one. When discount rates rise, the first group is marked down more.
That is what happened across the AI and semiconductor complex in July. The businesses themselves did not deteriorate. Earnings forecasts for many of them were revised higher during the very month their share prices fell. What changed was the discount rate applied to profits sitting years out. The pressure was not limited to the obvious names, either. Any company with its earnings weighted toward the future felt it, including in sectors where nothing had changed operationally at all.
The other side of that trade was a rotation into companies earning cash now. The gap between value and growth returns was, on some measures, the widest since 2003.
Look to spreads & breadth for signs of stress
We read July as a repricing, not something worse because of the reaction to higher yields in the credit market. Credit investors lend to companies and get paid a fixed return if all goes well, while losing capital if it does not. That lopsided payoff makes them constitutionally nervous, and they usually price bad news before equity investors do. However, through July, corporate credit spreads widened only modestly, and stayed well short of levels associated with genuine stress.
Market breadth held up too. Around 70% of companies in the S&P 500 remain above their 200-day average price, though July itself. This indicates more stocks are participating in the upside, but relative to the breadth indicator, fewer have moved positively month-to-month. The good news? Earnings didn’t disappoint.
Signal from the noise: the Mint 3x3x3 model
Sorting the signal from the noise is exactly what our 3x3x3 model is built to address. It is a proprietary framework that reads markets across three time horizons at once – tactical, business cycle and structural and weights them so that a noisy fortnight cannot drown out slower-moving signals. Each horizon draws on its own set of inputs, covering valuation, momentum, macroeconomic conditions and market internals, and each produces a reading on a scale from defensive to constructive. What emerges is one reading from the combined composites and an indication of risk position.
The purpose is discipline. Markets generate an enormous volume of information every day, most of which is noise, and the natural human response is to over-weight whatever happened most recently. A framework that forces us to look at the same question over three different timeframes makes that harder to do.
In July the two shorter term horizons moved toward caution while the structural reading remained unchanged. The composite now sits in cautious territory: nearer a defensive stance than it was at the start of the month, but short of the threshold at which the process would call for a discussion around defensive repositioning. The direction of travel is the more useful signal here, rather than the stand alone reading on any given day and ultimately our model is a guide – it informs our thinking but doesn’t replace it.
If you want to see which Mint funds are available on InvestNow, plus read any other opinion or commentary pieces from Alistair and the team at Mint, please visit their page on our website.
Disclaimer: The above article is intended to provide information and does not purport to give investment advice.
Mint Asset Management is the issuer of the Mint Asset Management Funds. Download a copy of the product disclosure statement HERE.
Is there a way these articles could be summarised or ‘translated’ in such a way that the average Joe Blogs could understand the meaning?
I know a bit about the subject but get bamboozled by the jargon.
Please put it in a simplified version for Dummies.
Hi Jonty, thanks for the feedback, we really appreciate it. Communicating market updates in plain English is important to us, and we’ll keep this in mind for future Market Wrap-Ups.