


InvestNow Market Wrap-Up: May 2025
Introducing Mugunthan Siva, Co-Founder & CIO at India Avenue, this month’s guest author of the InvestNow Market Wrap-Up.
Indian Equity Markets in May & Outlook for 2025
The month of May 2025 was an eventful month for Indian equity markets, marked by increasing foreign investor interest and specific sectoral trends playing out in the face of geopolitical events and policy changes. Of note, was a steep fall on May 9th as the India-Pakistan conflict appeared to be escalating. However, over the following weekend, resolution was reached on a ceasefire, which improved investor sentiment and saw a swift rebound in equity markets.
The NZD rose around 1% over the month against the INR, neutralising some of the gain (on an unhedged basis). In the year to date (YTD), the NZD has appreciated quite significantly against the INR. However, over 1 year the currency pair has remained relatively stable.
| As of 31 May 2025 | 1 month | YTD | 1 year |
| MSCI India (NZD) | 0.77% | -3.52% | 7.71% |
| MSCI India (INR) | 2.43% | 2.81% | 7.30% |
Source: MSCI, Refinitiv
In INR (Rupee) terms:
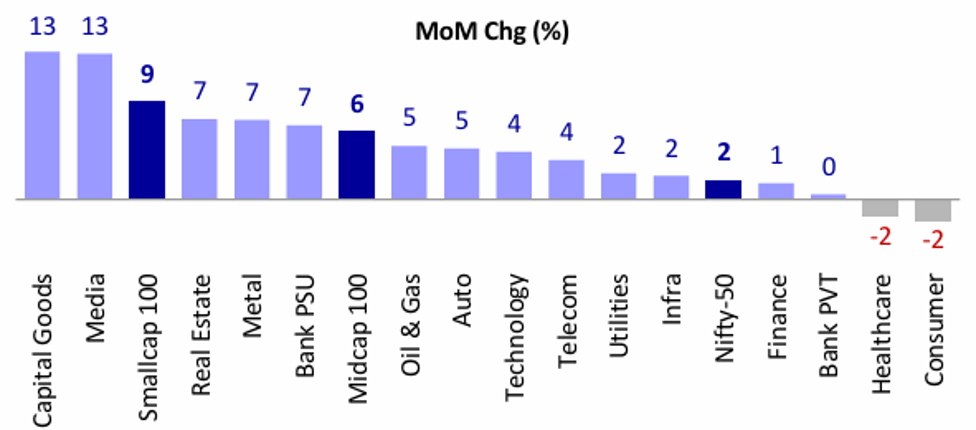
- Broadly the Indian equity markets advanced over the month with the Nifty 50 gaining 1.71%. The Mid, Small and Microcap Indices surged 6, 9% and 12% respectively
- Defence stocks rallied 22%, driven by government-led indigenisation efforts and strong order visibility. Railway stocks also rose 11.1%, benefiting from infrastructure expansion and policy support. EV & Internet sectors saw gains of 7.1% and 6.1%, respectively, as investors rotated into growth-oriented themes.
- Capital Goods, Media, Real Estate and Public Sector Banks performed well in May, benefitting from rising government spending and lower interest rates.
- Calendar Year to Date, the best performing sectors have been Financials, Metals and Infrastructure, whilst Pharmaceuticals, Real Estate and Technology have underperformed so far this year.
Source: Motilal Oswal, Bulls and Bears Report, May 2005.
The improvement in market sentiment saw Foreign Portfolio Investors (FPIs) continue to add exposure to India for the third month in a row (US$2.3 billion) into Indian equities, reversing outflows from October 2024-February 2025. Key drivers of FII inflows were a weakening USD, which focused investors on Emerging Market allocations, as well as receding inflation and signs of improving earnings in India. Sectors attracting FII interest include Autos and Components, Telecom, and Financials. Domestic Portfolio Investors (DPI’s) added US$7.9 billion over May, their third largest monthly inflow over the last five years, which tends to favour small and mid-cap stocks.
Local investors in India have become a significant investor in their own capital markets over the last five years. In 2024, they invested an average of US$5 billion per month into their own market, typically via systematic investment plans (monthly investing from salaried accounts).
Macroeconomic & policy influences were broadly positive for the month, with the India signing a free-trade agreement with the UK and there are further expectations of an India-US trade deal. Additionally, there have been two rate cuts of 0.25% each in February and April and on Friday June 6th a further surprise rate cut by the Reserve Bank of India of 0.50% to support economic growth and add liquidity to the system.
Justifying India’s valuations
Valuations remain a concern for foreign investors who have a broad mandate to invest across the globe. Indian markets (Nifty 50) are trading close to 21x one year forward earnings. Whilst Indian equity markets are trading close to their 10-year average, relative to other regions in Emerging Markets and Europe, India appears to be expensive relative to other equity markets around the world, except for the US.
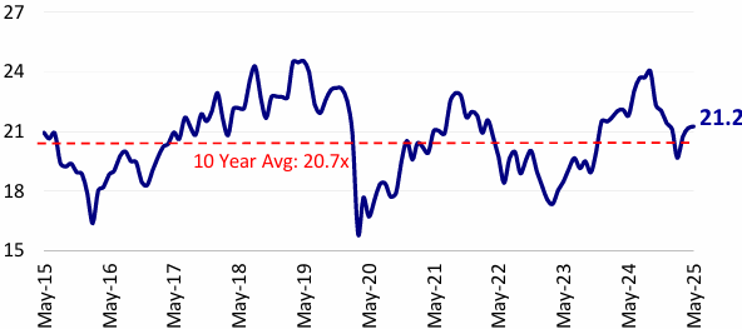
Source: Motilal Oswal, Bulls and Bears Report, May 2005.
India’s valuation premium may appear elevated compared to other regions, several key factors—favourable demographics, robust earnings growth, high returns on equity (ROEs), and strong macroeconomic fundamentals—justify its position. Lower oil prices, tax cuts, contained inflation, and declining interest rates further strengthen the economic outlook, providing solid support for equity markets.
Why did Indian markets pull back from October 2024 to February 2025?
Earnings growth in FY25 was close to zero for the Nifty 50 (India’s Top 50 companies by size) and this led markets to experience downside from October 2024 – February 2025. Additionally, China announced stimulus is September last year and several global investors took the opportunity to take some profits from their Indian equity market exposure and switched to China, based on this stimulus and cheaper valuations. However, the March Quarter 2025 earnings showed signs of improvement and were above expectations. After a brief pause for 6-9 months, it appears India’s demographics is once again driving robust earnings growth in the region.
Outlook for the rest of 2025
In a world where global trade stands at a staggering US$33 trillion, India remains a relatively small player, with FY25 exports reaching US$825 billion. This gap underscores the immense potential for India to expand its footprint in global supply chains. Despite its rapid rise—having overtaken Japan to become the world’s fourth-largest economy—India’s participation in international trade remains modest. However, with free trade negotiations gaining momentum, India is likely to play a more significant role in global commerce, capitalizing on its manufacturing and services strengths.
Several short-term tailwinds support India’s equity market:
- Monetary Policy: 1% of interest rate cuts is expected to improve liquidity and spur growth, benefiting sectors like banking and NBFCs.
- Fiscal Policy: The increase in the tax threshold will provide relief to the middle class, boosting consumer spending and retail sectors.
- Weather Conditions: A normal southwest monsoon (June-September) is anticipated, supporting agriculture and rural consumption.
- Commodity Prices: Weaker oil prices lower input costs for industries, improving corporate earnings.
In the short-term, 1% of interest rate cuts, a forecasted normal south-west monsoon (June-September), an increase in the tax threshold (beneficial for tax-paying middle class) as well as weaker oil prices, will be positive for financial and consumption stocks. India’s upcoming festival season should be positive given these tailwinds.
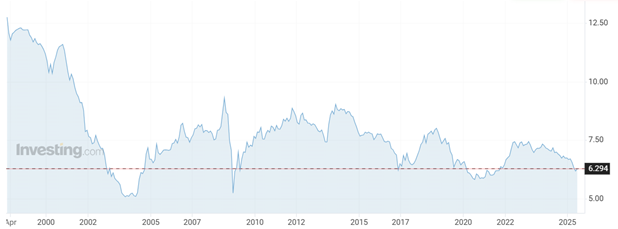
Source: Investing.com
India’s 10-year bond yields are now approaching territory where private investment / capex typically increases as the cost of capital reduces. Over history a drop in yields has led to a good environment for Indian equities (2004-2006, 2009, 2017 and 2021) after yields fell.
The caveat to all of this are global macroeconomic events. Given a very policy driven government in the US, which is leading to reshuffling of trade routes and impacting potential geopolitical risks – it makes sense to focus on long-term fundamentals, rather than get caught in momentum crosshairs. Typically, demographics and long-term megatrends tend to supersede policy initiatives or sentiment.
If you want to see which India Avenue investments are available on InvestNow, please visit their page on our website.
InvestNow Market Wrap-Up: May 2025
Introducing Mugunthan Siva, Co-Founder & CIO at India Avenue, this month’s guest author of the InvestNow Market Wrap-Up.
Indian Equity Markets in May & Outlook for 2025
The month of May 2025 was an eventful month for Indian equity markets, marked by increasing foreign investor interest and specific sectoral trends playing out in the face of geopolitical events and policy changes. Of note, was a steep fall on May 9th as the India-Pakistan conflict appeared to be escalating. However, over the following weekend, resolution was reached on a ceasefire, which improved investor sentiment and saw a swift rebound in equity markets.
The NZD rose around 1% over the month against the INR, neutralising some of the gain (on an unhedged basis). In the year to date (YTD), the NZD has appreciated quite significantly against the INR. However, over 1 year the currency pair has remained relatively stable.
| As of 31 May 2025 | 1 month | YTD | 1 year |
| MSCI India (NZD) | 0.77% | -3.52% | 7.71% |
| MSCI India (INR) | 2.43% | 2.81% | 7.30% |
Source: MSCI, Refinitiv
In INR (Rupee) terms:
- Broadly the Indian equity markets advanced over the month with the Nifty 50 gaining 1.71%. The Mid, Small and Microcap Indices surged 6, 9% and 12% respectively
- Defence stocks rallied 22%, driven by government-led indigenisation efforts and strong order visibility. Railway stocks also rose 11.1%, benefiting from infrastructure expansion and policy support. EV & Internet sectors saw gains of 7.1% and 6.1%, respectively, as investors rotated into growth-oriented themes.
- Capital Goods, Media, Real Estate and Public Sector Banks performed well in May, benefitting from rising government spending and lower interest rates.
- Calendar Year to Date, the best performing sectors have been Financials, Metals and Infrastructure, whilst Pharmaceuticals, Real Estate and Technology have underperformed so far this year.
Source: Motilal Oswal, Bulls and Bears Report, May 2005.
The improvement in market sentiment saw Foreign Portfolio Investors (FPIs) continue to add exposure to India for the third month in a row (US$2.3 billion) into Indian equities, reversing outflows from October 2024-February 2025. Key drivers of FII inflows were a weakening USD, which focused investors on Emerging Market allocations, as well as receding inflation and signs of improving earnings in India. Sectors attracting FII interest include Autos and Components, Telecom, and Financials. Domestic Portfolio Investors (DPI’s) added US$7.9 billion over May, their third largest monthly inflow over the last five years, which tends to favour small and mid-cap stocks.
Local investors in India have become a significant investor in their own capital markets over the last five years. In 2024, they invested an average of US$5 billion per month into their own market, typically via systematic investment plans (monthly investing from salaried accounts).
Macroeconomic & policy influences were broadly positive for the month, with the India signing a free-trade agreement with the UK and there are further expectations of an India-US trade deal. Additionally, there have been two rate cuts of 0.25% each in February and April and on Friday June 6th a further surprise rate cut by the Reserve Bank of India of 0.50% to support economic growth and add liquidity to the system.
Justifying India’s valuations
Valuations remain a concern for foreign investors who have a broad mandate to invest across the globe. Indian markets (Nifty 50) are trading close to 21x one year forward earnings. Whilst Indian equity markets are trading close to their 10-year average, relative to other regions in Emerging Markets and Europe, India appears to be expensive relative to other equity markets around the world, except for the US.
Source: Motilal Oswal, Bulls and Bears Report, May 2005.
India’s valuation premium may appear elevated compared to other regions, several key factors—favourable demographics, robust earnings growth, high returns on equity (ROEs), and strong macroeconomic fundamentals—justify its position. Lower oil prices, tax cuts, contained inflation, and declining interest rates further strengthen the economic outlook, providing solid support for equity markets.
Why did Indian markets pull back from October 2024 to February 2025?
Earnings growth in FY25 was close to zero for the Nifty 50 (India’s Top 50 companies by size) and this led markets to experience downside from October 2024 – February 2025. Additionally, China announced stimulus is September last year and several global investors took the opportunity to take some profits from their Indian equity market exposure and switched to China, based on this stimulus and cheaper valuations. However, the March Quarter 2025 earnings showed signs of improvement and were above expectations. After a brief pause for 6-9 months, it appears India’s demographics is once again driving robust earnings growth in the region.
Outlook for the rest of 2025
In a world where global trade stands at a staggering US$33 trillion, India remains a relatively small player, with FY25 exports reaching US$825 billion. This gap underscores the immense potential for India to expand its footprint in global supply chains. Despite its rapid rise—having overtaken Japan to become the world’s fourth-largest economy—India’s participation in international trade remains modest. However, with free trade negotiations gaining momentum, India is likely to play a more significant role in global commerce, capitalizing on its manufacturing and services strengths.
Several short-term tailwinds support India’s equity market:
- Monetary Policy: 1% of interest rate cuts is expected to improve liquidity and spur growth, benefiting sectors like banking and NBFCs.
- Fiscal Policy: The increase in the tax threshold will provide relief to the middle class, boosting consumer spending and retail sectors.
- Weather Conditions: A normal southwest monsoon (June-September) is anticipated, supporting agriculture and rural consumption.
- Commodity Prices: Weaker oil prices lower input costs for industries, improving corporate earnings.
In the short-term, 1% of interest rate cuts, a forecasted normal south-west monsoon (June-September), an increase in the tax threshold (beneficial for tax-paying middle class) as well as weaker oil prices, will be positive for financial and consumption stocks. India’s upcoming festival season should be positive given these tailwinds.
Source: Investing.com
India’s 10-year bond yields are now approaching territory where private investment / capex typically increases as the cost of capital reduces. Over history a drop in yields has led to a good environment for Indian equities (2004-2006, 2009, 2017 and 2021) after yields fell.
The caveat to all of this are global macroeconomic events. Given a very policy driven government in the US, which is leading to reshuffling of trade routes and impacting potential geopolitical risks – it makes sense to focus on long-term fundamentals, rather than get caught in momentum crosshairs. Typically, demographics and long-term megatrends tend to supersede policy initiatives or sentiment.
If you want to see which India Avenue investments are available on InvestNow, please visit their page on our website.
Disclaimer:
- A copy of the PDS for the India Avenue Equity Fund (H Class) can be obtained by writing to India Avenue on IA@indianavenue.com.au or by visiting www.indiaavenue.com.au.
- Equity Trustees Limited is the Responsible Entity (ABN 46 004 031 298, AFSL 240975) for the India Avenue Equity Fund (H Class).
- This Note (‘Note’) has been produced by India Avenue Investment Management Limited (‘IAIM’) ABN 38 604 095 954, AFSL 478233 and has been prepared for informational and discussion purposes only. This does not constitute an offer to sell or a solicitation of an offer to purchase any security or financial product or service. Any such offer or solicitation shall be made only pursuant to a Product Disclosure Statement, Information Memorandum, or other offer document (collectively ‘Offer Document’) relating to an IAIM financial product or service.
- This Note does not constitute a part of any Offer Document issued by IAIM. The information contained in this Note may not be reproduced, used, or disclosed, in whole or in part, without prior written consent of IAIM.
- Past performance is not necessarily indicative of future results and no person guarantees the performance of any IAIM financial product or service or the amount or timing of any return from it. There can be no assurance that an IAIM financial product or service will achieve any targeted returns, that asset allocations will be met or that an IAIM financial product or service will be able to implement its investment strategy and investment approach or achieve its investment objective.
- Statements contained in this Note that are not historical facts are based on current expectations, estimates, projections, opinions and beliefs of IAIM. Such statements involve known and unknown risks, uncertainties and other factors, and undue reliance should not be placed thereon. Additionally, this Note may contain “forward-looking statements”. Actual events or results or the actual performance of an IAIM financial product or service may differ materially from those reflected or contemplated in such forward-looking statements. Any trademarks, logos, and service marks contained herein may be the registered and unregistered trademarks of their respective owners. Nothing contained herein should be construed as granting by implication, or otherwise, any license or right to use any trademark displayed without the written permission of the owner.
- Certain economic, market or company information contained herein has been obtained from published sources prepared by third parties. While such sources are believed to be reliable, neither IAIM nor any of its respective officers or employees assumes any responsibility for the accuracy or completeness of such information. None of IAIM or any of its respective officers or employees has made any representation or warranty, express or implied, with respect to the correctness, accuracy, reasonableness or completeness of any of the information contained in this and they expressly disclaim any responsibility or liability, therefore. No person, including IAIM has any responsibility to update any of the information provided in this Note.
- Neither this Note nor the provision of any Offer Document issued by IAIM is, and must not be regarded as, advice or a recommendation or opinion in relation to an IAIM financial product or service, or that an investment in an IAIM financial product or service is suitable for you or any other person. Neither this Note nor any Offer Document issued by IAIM considers your investment objectives, financial situation, and particular needs. In addition to carefully reading the relevant Offer Document issued by IAIM you should, before deciding whether to invest in an IAIM financial product or service, consider the appropriateness of investing or continuing to invest, having regard to your own objectives, financial situation, or needs. IAIM strongly recommends that you obtain independent financial, legal and taxation advice before deciding whether to invest in an IAIM financial product or service.
Leave A Comment