InvestNow Market Wrap-Up: July 2024
Written by Jason Choy, InvestNow Senior Portfolio Manager
Market Dashboard
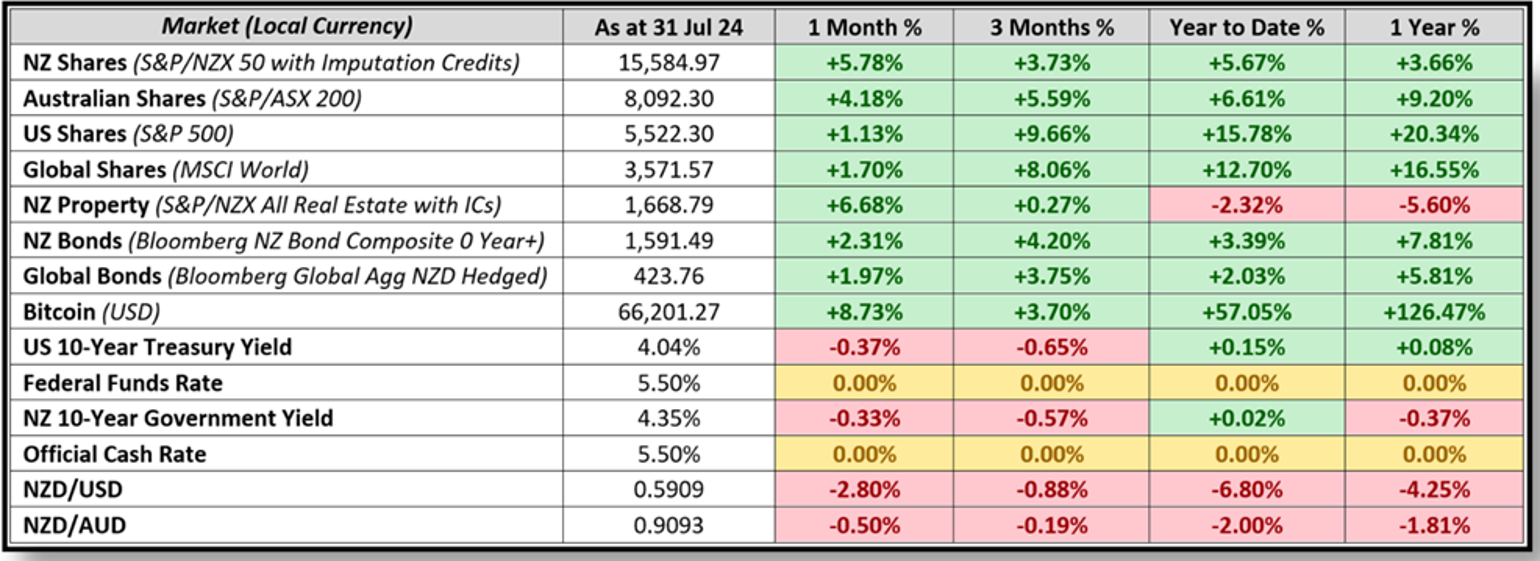
In a nutshell: Global markets eked out gains in July amid volatility, while local markets notched their strongest month of the year. Markets around the world digested a swath of economic, political and company specific developments over the month, which initially kicked off positively with major indexes establishing more record-highs. However, disappointing earnings from U.S. tech stocks and increased optimism of imminent Fed rate cuts fuelled pullbacks and a rotation from large-cap stocks towards interest rate-sensitive assets. Meanwhile, Trans-Tasman markets performed strongly, with New Zealand shares and property surging in July, bolstered by the prospect of interest rates coming down faster than expected. Australian shares weren’t far behind, benefitting from a positive inflation outcome.
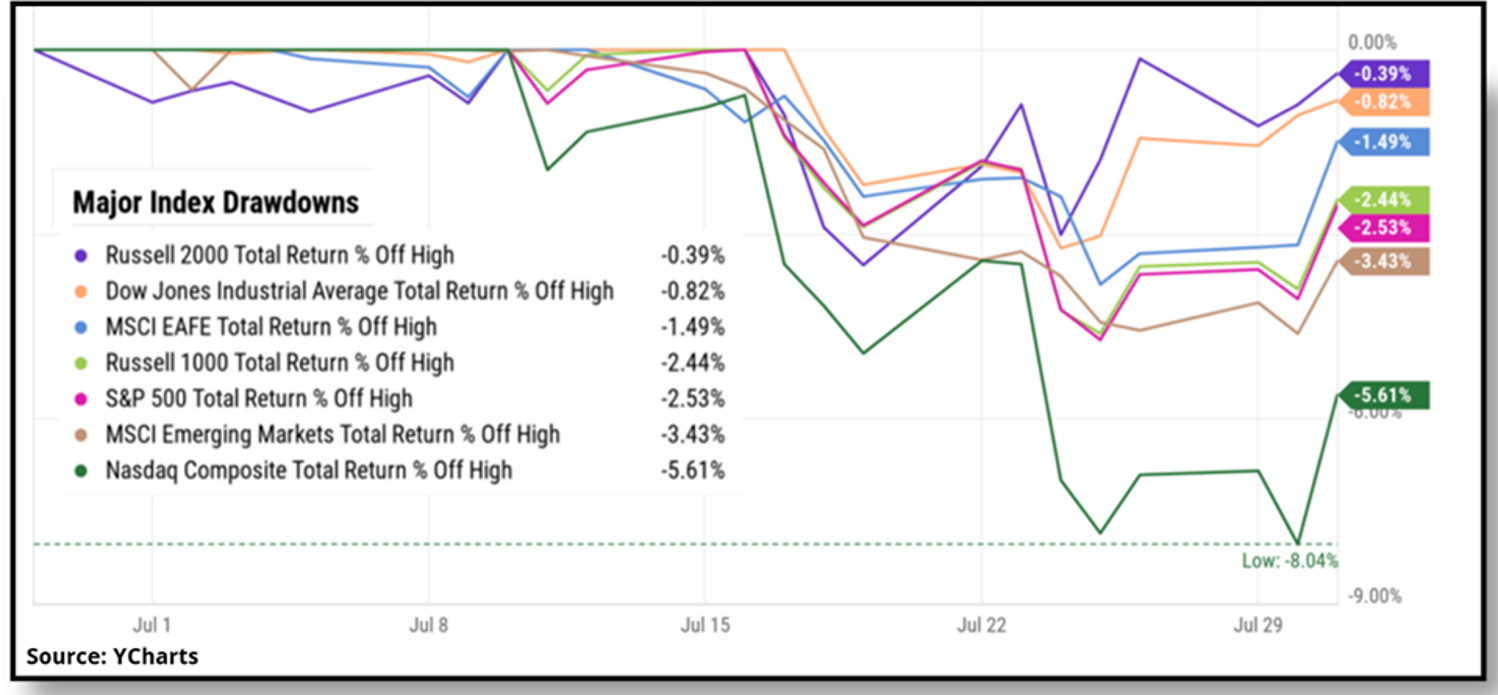
July started off strong with more record highs, but major pullbacks occurred as the month progressed.
Global Markets Summary: July 2024
Global equity markets saw a roller-coaster ride over the month but ultimately still finished higher. Investors became concerned about concentration risk in the market amongst a handful of mega-cap companies, who need to increasingly meet high hurdles to justify their lofty valuations. This helped fuel a rotation toward previously unloved corners of the market, such as small caps, defensive names and value stocks. Small and mid-cap stocks outperformed their large-cap counterparts significantly, closing most of the performance gap year-to-date, which led to one of the largest one-month outperformance of the Russell 2000 (small-cap index) versus the tech-heavy NASDAQ-100 index in over 20 years. Overall, the MSCI All Country World Index finished the month of July +1.3% higher in NZD-hedged terms, while being much stronger in unhedged terms, up +4.2% due to further NZD weakness.
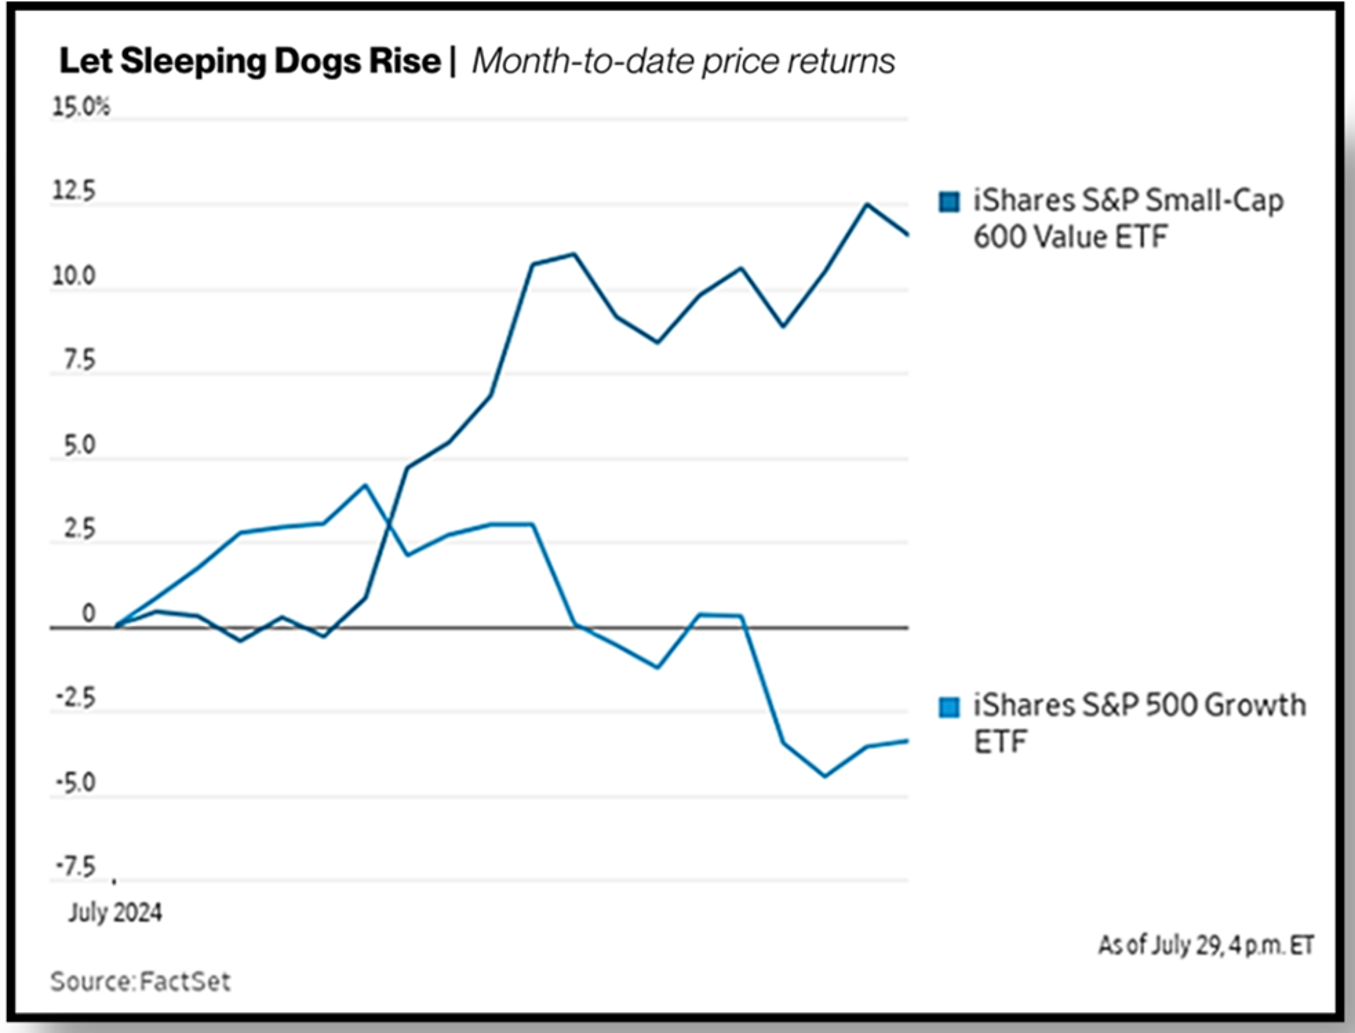
July saw a rotation from large-cap and growth stocks to the previously unloved small-cap and value stocks.
US stocks finish the month marginally higher, but the positive return obscures significant volatility over July. From the beginning of the year until the last week of July, the S&P 500 maintained a remarkably consistent upward trajectory en route to setting 38 all-time closing records. The S&P 500 also went over 350 trading sessions without a 2% drop – its longest streak in over 17 years. However, on July 24th, US stocks suffered their worst decline since December 2022, falling -2.3% following lacklustre earnings results from ‘Magnificent Seven’ constituents Tesla and Alphabet. This fuelled a wider sell-off in tech stocks, with the NASDAQ slumping -3.6% that day (its fifth 2%+ daily decline this year) and finishing the month -0.7% lower.
The rotation away from mega-cap tech names resulted from a ‘perfect storm’ of AI pessimism and encouraging economic data that all but solidified the prospect of imminent rate cuts. Investors have become increasingly sceptical about whether the avalanche of money tech companies have been pouring into building AI infrastructure will actually translate into outsized future profits. Meanwhile, stronger than expected annualised GDP growth of 2.8% in the US, coupled with US inflation easing to 3.0% year-on-year has led to markets earmarking September for the Federal Reserve to kick-start its rate easing cycle. Against this backdrop, a shift to the broader market seemed to be the trade of choice for investors.
Another catalyst for these market movements has been political developments that ramped up in July. A poor showing by Biden at the first presidential debate, followed by the failed assassination attempt on Trump, put the former president in pole position to win the November elections. This ignited the ‘Trump Trade’, which favours smaller, domestically orientated firms and ‘old economy’ industries at the expense of large tech companies, reflecting Trump’s policies on corporate tax cuts and higher tariffs. However, Trump’s probability of becoming the next US President dropped significantly, from approximately 70% to 50%, following the news that Kamala Harris will replace Joe Biden as the Democratic nominee. This led to a stabilisation of markets, which priced in a lower risk of Trump’s more inflationary fiscal policy.
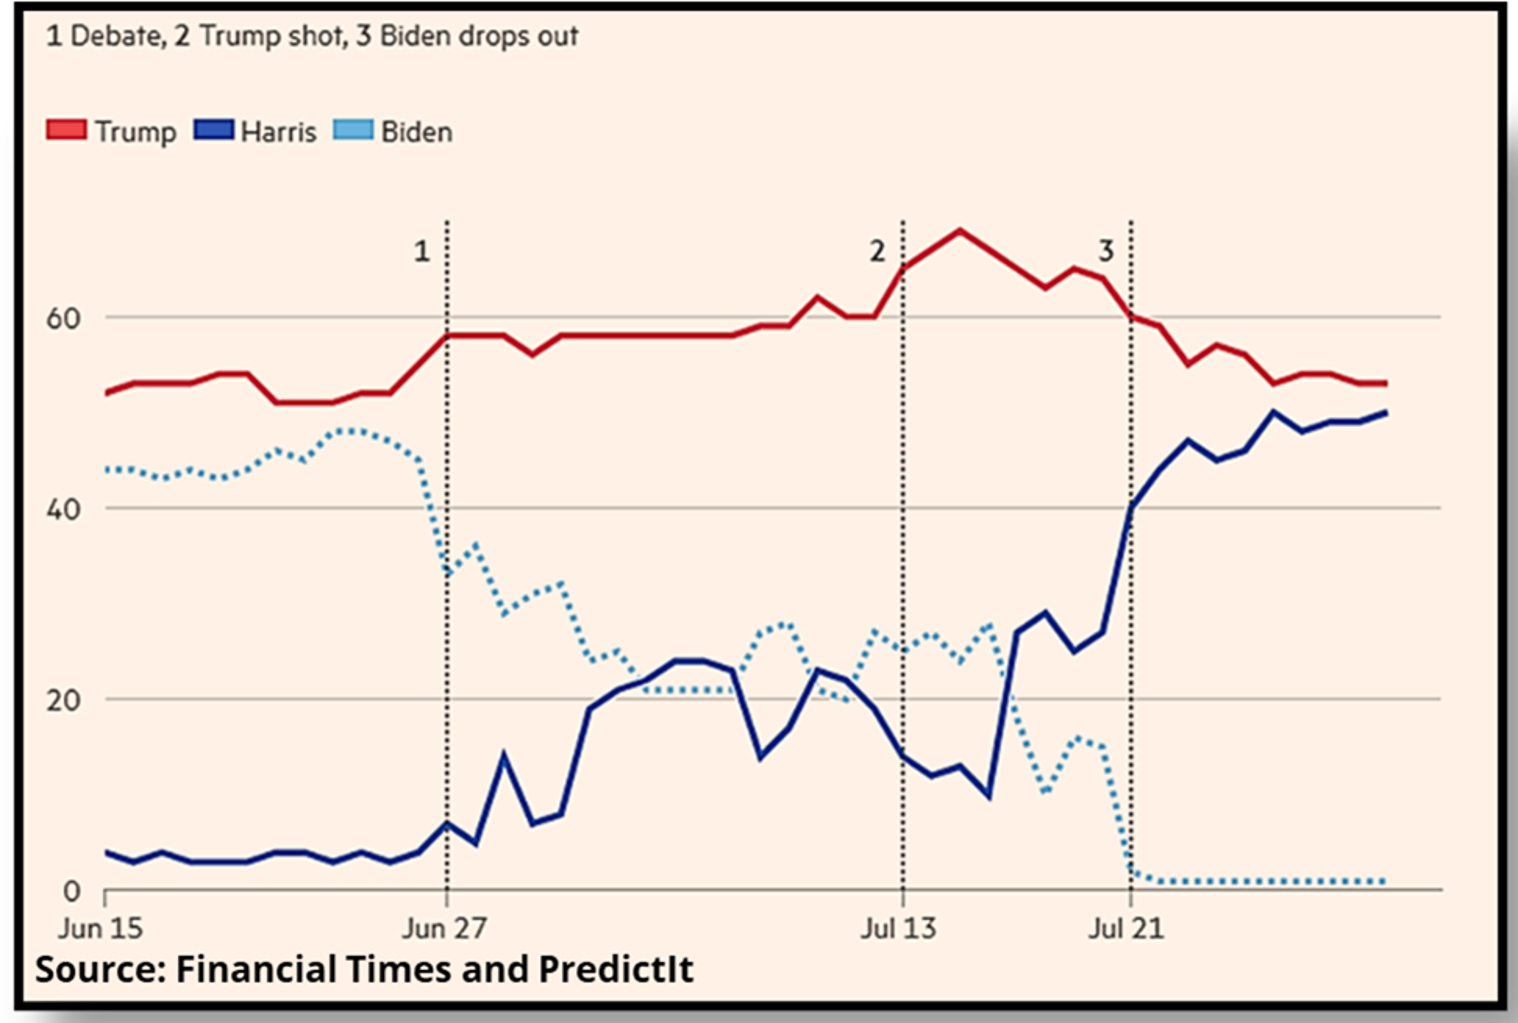
Financial markets were shaken in July as political action heated up in the US with the upcoming elections.
Eurozone shares notched a small gain in July, but lagged their US and UK counterparts, with the MSCI Europe ex-UK Index returning +0.6% over the month. While Eurozone GDP growth was positive at +0.3% quarter-on-quarter in Q2, other data releases were less rosy. Germany saw a -0.1% fall in GDP and the Eurozone Purchasing Managers’ Index (PMI), which surveys the activity of companies in the manufacturing and service sectors indicated that the eurozone economy was near stagnation. This mixed economic data, combined with the uncertainty of the French parliamentary election (where no political group achieved an outright majority) tempered market performance. Meanwhile, the European Central Bank (ECB) kept interest rates on hold over the month, although ECB Governor Lagarde noted another cut in September was wide open and data dependent. This was as eurozone inflation for July was forecasted to increase slightly to 2.6%, up 0.1% from June.
UK shares performed well over the month amid stronger than expected economic growth, with the FTSE 100 rising +2.5% in July, despite headwinds of a strong currency impacting the sterling value of overseas earnings. The landslide Labour general election victory early in the month helped fuel hopes for a sustained recovery in the economy, which were further bolstered by economic surveys showing business confidence and activity had picked up markedly in July. With annual inflation holding steady at 2.0%, investor attention is now focused on the timing and quantum of the Bank of England’s rate easing cycle.
Japanese shares were volatile over the month, hitting record highs in early July, but finishing lower with the TOPIX index returning -0.5%. The decline was driven by the wider pullback in AI and tech stocks as well as pressure from a strengthening yen. Earlier than expected Fed rate cuts, coupled with a surprise 15 bps Bank of Japan rate hike to 0.25%, led to the yen surging 6.5% against the US dollar in July – its strongest monthly move since 2016. Exporters such as those in Japan’s auto, technology and machinery industries were weighed down by the strengthening yen’s negative impact on profits, but more defensive sectors such as pharmaceuticals, foods and construction supported the Japanese market during a turbulent July.
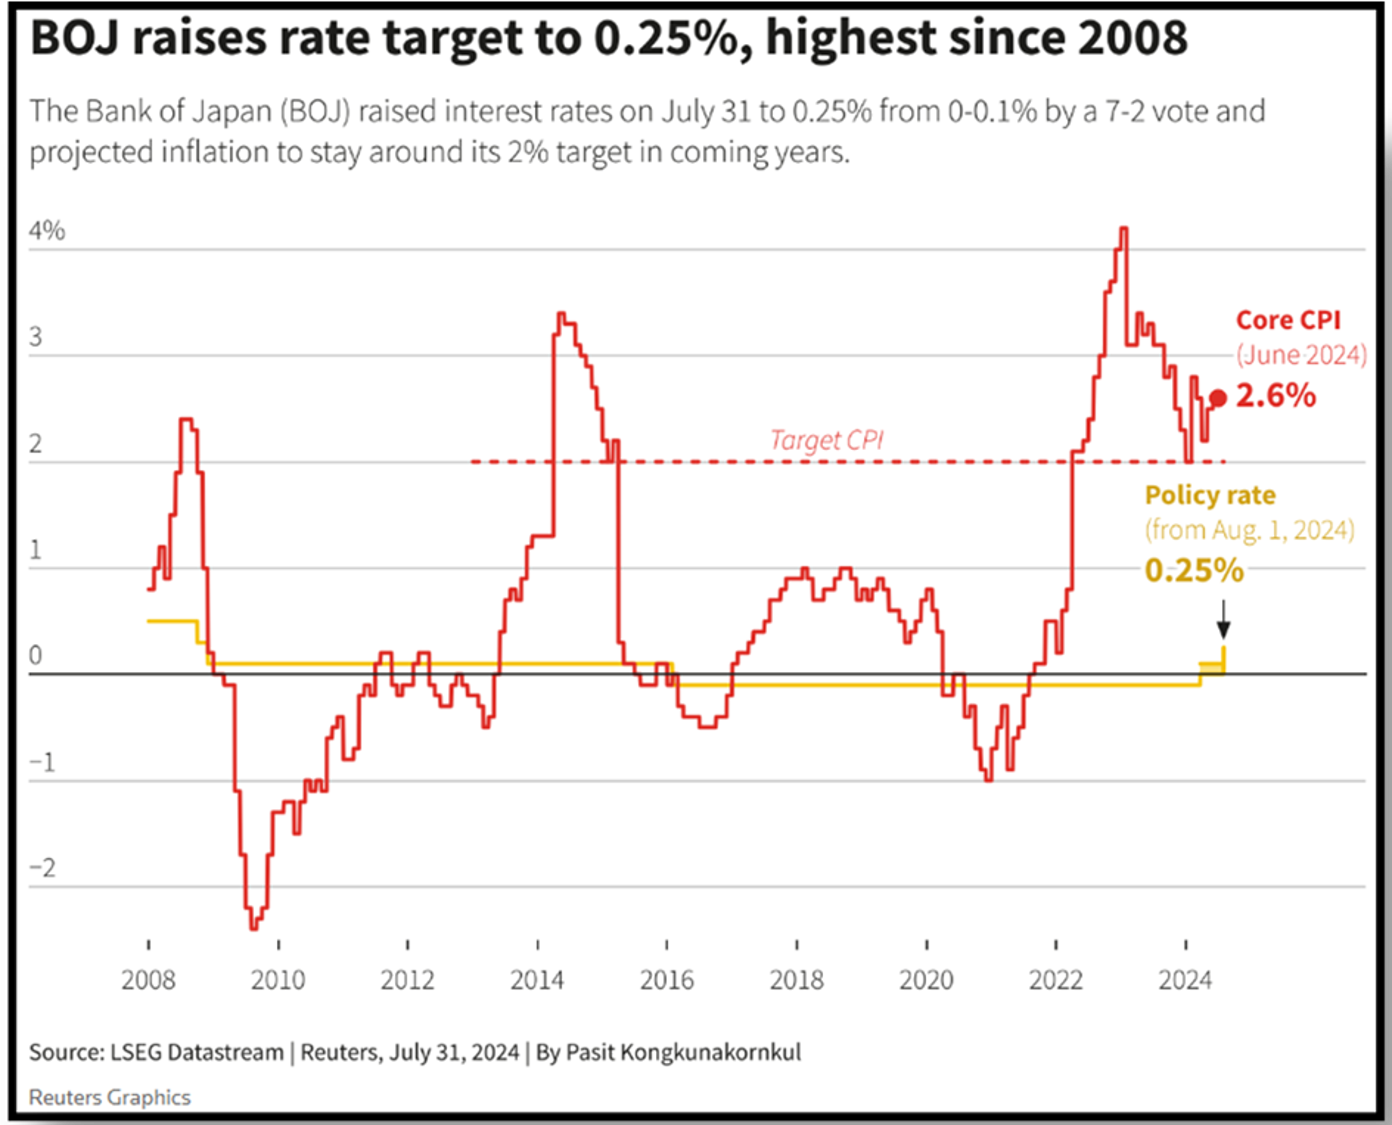
The Bank of Japan surprised markets by rising rates for only the second time since 2007.
Wider Asian and Emerging markets were mixed in July, with stocks in Taiwan (-3.6%) and Korea (-1.0%) badly hit by the sell-off in technology stocks, although Taiwan remains the best-performing Asia-Pacific index market year-to-date. The Chinese equity market also struggled, falling -1.2% due to continued challenges in the real estate sector and its spillover impact on the broader economy, which grew at just 4.7% year-on-year over Q2 (towards the lower end of the official target). Chinese authorities did however implement measures to provide more liquidity to the financial system to stimulate lending and growth. The poor performance of index heavyweights China and Taiwan saw emerging markets lag their developed counterparts, although India, Brazil and Mexico were lone bright spots for emerging market indices.
Global bonds saw a positive month in July, with government bond yields (which move inversely to bond prices) dropping across major markets, propelled by easing inflation and expected interest rate cuts. The start of any rate-cutting cycle is crucial for bond markets, so central banks were again centre stage. The US Federal Reserve held rates again in July for seemingly the last time, with Fed Chair Powell steering markets towards a September rate cut amid lower inflation and weak labour market data. Upcoming rate cuts from the European Central Bank and Bank of England are also on market watcher’s bingo cards. Overall, this saw the Bloomberg Global Aggregate Bond Index hedged to the NZD return +2.0% in July.
Key updates for the Kiwi investor:
The New Zealand share market hit a 30-month high and recorded its strongest month of the year in July, with the S&P/NZX 50 Gross Index (with imputation credits) returning +5.8% over the month. Out of the NZX 50, 43 companies reported positive returns, as the local market benefited from softening inflation, which came in at an annual rate of just 3.3% over Q2, down from 4.0% in Q1 and less than half of the 7.3% peak in 2022. This inflation reading certainly surprised on the downside and was materially below the 3.6% that the Reserve Bank of New Zealand (RBNZ) had pencilled in at this stage and just shy of the RBNZ’s 1-3% target range. This supported the prospect of sooner-than-expected interest rate cuts, which is a boon for the more interest rate sensitive local market. The New Zealand share market was also bolstered by corporate activity, with private equity firms making takeover offers for retirement village operator Arvida Group, which was up a staggering +74% in July.
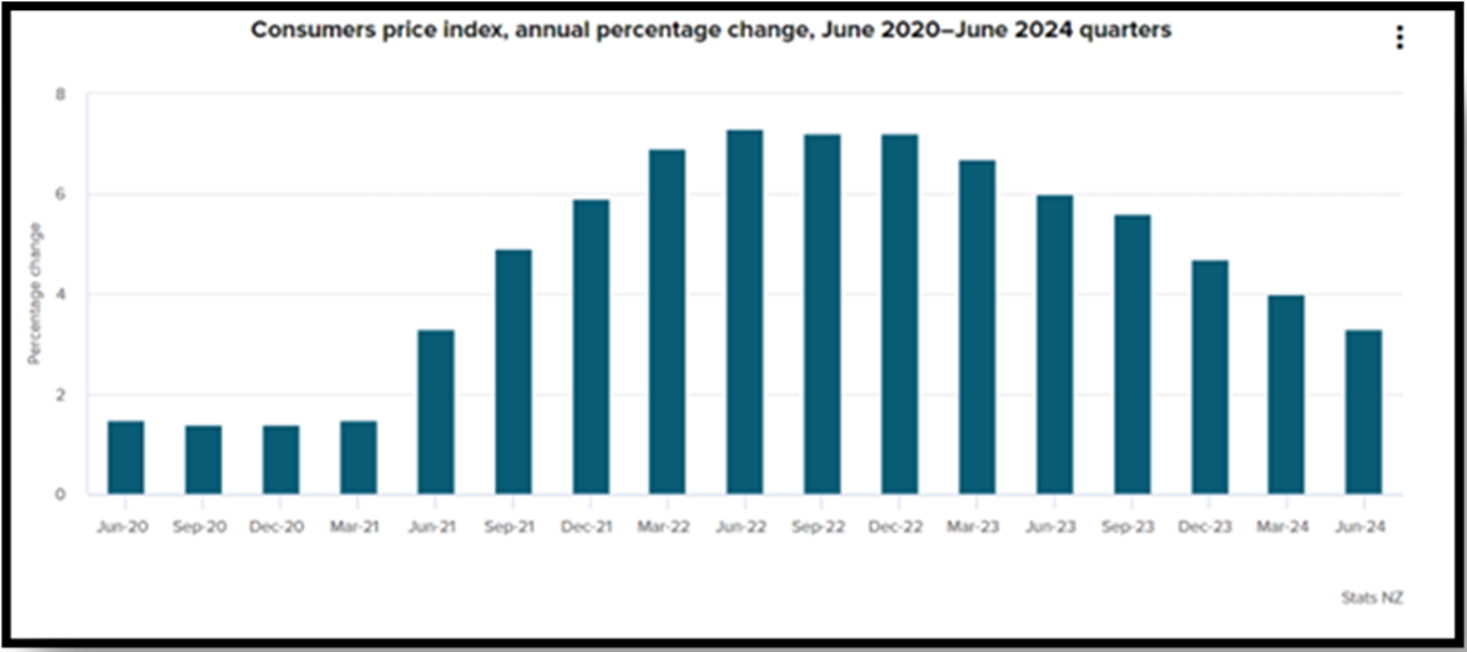
The New Zealand market was bolstered by inflation retreating to 3.3% – just shy of the RBNZ’s 1-3% target.
Local bond markets also impressed in July, with the Bloomberg NZBond Composite 0+ Yr Index returning +2.3% over the month. Longer-term interest rates drifted lower amid global events and ongoing weakness in domestic economic data, with the New Zealand 10-year yield falling 33 bps to end at 4.35%. Despite the RBNZ holding rates steady again in July, there was a clear dovish pivot or softening in their tone and outlook for the OCR going forward. The market expectations of future OCR levels changed markedly over the month with softening inflation and weak economic data. At the beginning of July, the market had forecasted the OCR would be 4.7% in one year’s time, while the end of July saw the market price in an OCR of 3.7% in one year’s time – a full 1.0% lower.
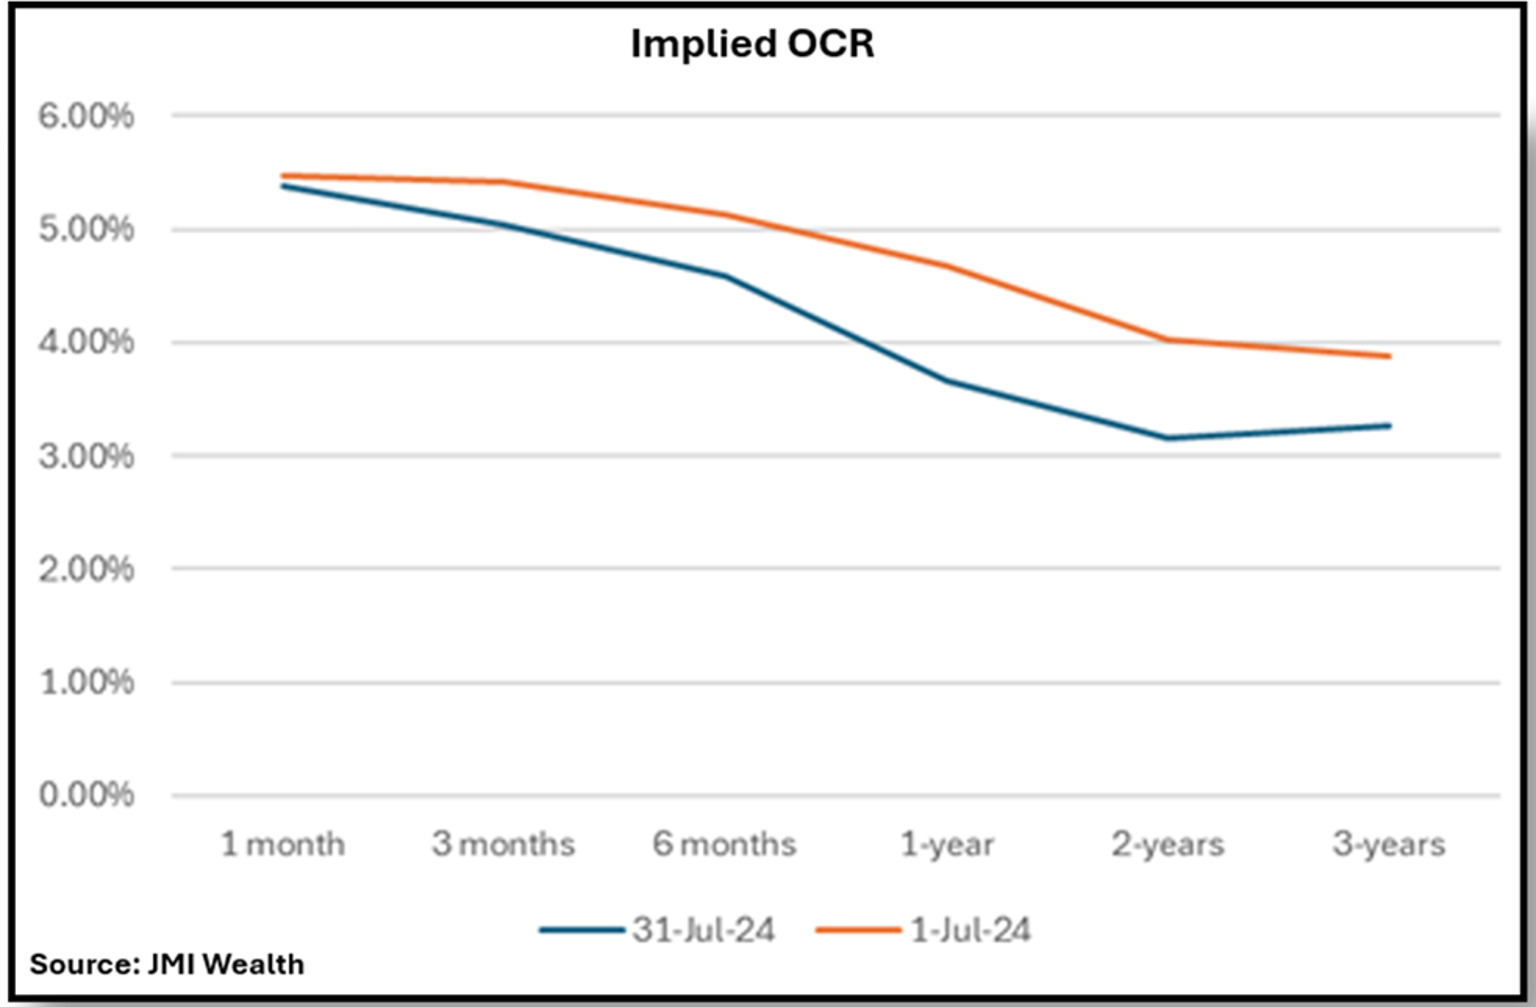
Market expectations of the OCR dropped significantly over July amid a dovish pivot from the RBNZ.
What a difference a couple of months makes as the RBNZ has seemingly flip-flopped on their OCR track. In their May policy review meeting, the RBNZ had not pencilled in rate cuts until mid-2025 at earliest, and even discussed the prospect of increasing rates! While the result of their July meeting was the same as May (a hold), there was no rate hike discussed in July, and instead, the Bank noted that “tight monetary policy is feeding through to domestic demand more strongly than expected1”. The RBNZ’s biggest hint toward an earlier start to the rate easing cycle was an acknowledgement that while monetary policy needs to remain restrictive, the extent will be tempered as inflation pressures decline.
The RBNZ has likely realised they are behind the curve, as many find it hard to believe that the NZ economy could have changed so significantly in the two months between the monetary policy decisions. The RBNZ is now likely looking to make up for lost time, which history shows they aren’t afraid to do. With three easing cycles within a 10-year span ending with the Global Financial Crisis, the RBNZ has a track record of aggressively cutting interest rates when necessary – could we see more of the same in this upcoming rate easing cycle?
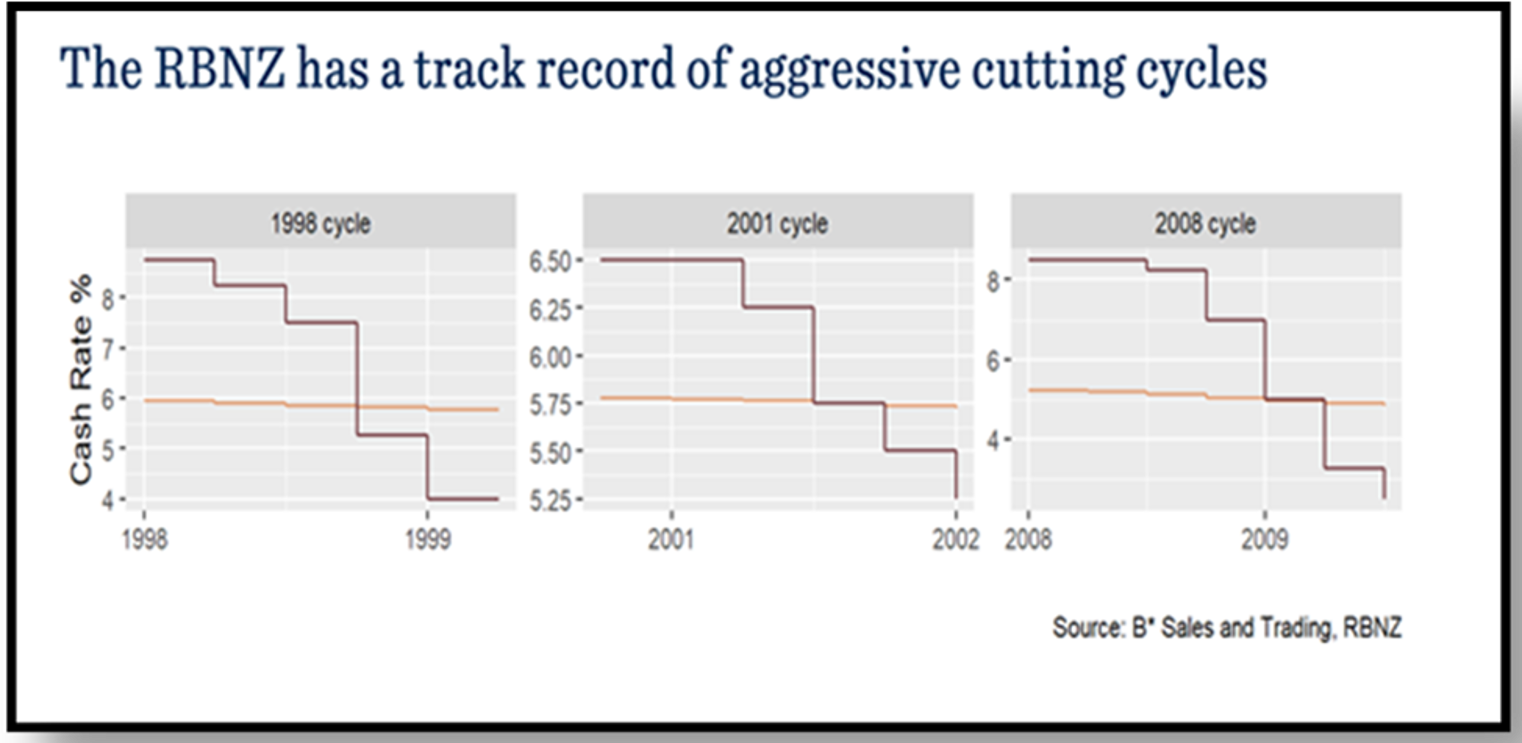
With a history of aggressively cutting rates, the RBNZ appears ready to make up for lost time in 2024.
Chart of the month:
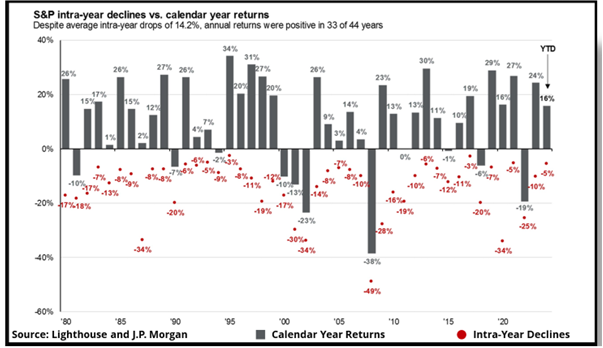
Lighthouse highlights that while sizable pullbacks often occur during the year, more often than not the full year returns are well worth seeing through any intra-year volatility.
Our Chart of the Month is from Lighthouse Funds, with data from J.P. Morgan, which contrasts the hefty intra-year drops the S&P 500 can often experience against the strong full-year returns on offer. Dating back nearly 50 years, the S&P 500 experienced an average pullback during the year of -14.2%. While it can be nerve-racking to see your portfolio drop by nearly 15% during the year and tempting to switch over to something more conservative to soften the blow, an investor who remains invested for the full year ends up generating a positive return of 75% of the time.
Lighthouse highlights that drawdowns and volatility are a regular market reality – historically, small pullbacks of 5-10% occur several times a year, while larger corrections with a 10-15% fall happen about once a year. Meanwhile, bear markets (with a more than 20% fall) might happen every 3 years or so, with the last one in 2022, while market crashes of 30% or more might happen every decade (e.g. 2000 dotcom, 2008 GFC and 2020 Covid crash). Yet despite this, the annual return of the S&P 500 has been over 10% p.a., with investors who stayed on course year-in and year-out being handsomely rewarded.
If they happen so often, how can investors best avoid market falls? Lighthouse offers this simple rule of thumb2: more money has been lost trying to avoid corrections and bear markets than has actually been lost in corrections and bear markets. While investors can opt for more conservative investment options that provide a smoother ride, this typically comes at the cost of higher long-term returns. If you have a multi-year investment horizon, then sacrificing performance to avoid daily or monthly swings often results in giving up sizable returns just so you can feel better along the way.
Lighthouse emphasises that for most investors, the key organ is the stomach, not the brain. If you can tolerate pullbacks, corrections, bear markets and crashes, then history tells us that equity investing will deliver superior long-term returns.
1OCR 5.50% – Inflation Approaching Target Range – Reserve Bank of New Zealand – Te Pūtea Matua (rbnz.govt.nz)
2July 2024 Market Wrap up with Lighthouse Funds
What we’ve been reading:
- Dexus: Global REITs – The Most Attractive Sub-sectors
- Franklin Templeton: Central Banks – Will inflation stay, or will it go?
- Harbour: Top 10 Risks and Opportunities for 2024 – A Mid-Year Reflection
- Milford: Trust Tax Changes this Year – Worth Another Look at Investment Fund PIEs
- Mint: Are NZ Equities a Buy?
- Morningstar: KiwiSaver Survey | June Quarter 2024
- Nikko: The Future Isn’t What it Was
- Octagon: Cash is Not Always King
- Pathfinder: Shop Local, Invest Local
- Squirrel: Greater Competition in Banking Starts with a Fairer Rate on Kiwi Savings
InvestNow Market Wrap-Up: July 2024
Written by Jason Choy, InvestNow Senior Portfolio Manager
Market Dashboard
In a nutshell: Global markets eked out gains in July amid volatility, while local markets notched their strongest month of the year. Markets around the world digested a swath of economic, political and company specific developments over the month, which initially kicked off positively with major indexes establishing more record-highs. However, disappointing earnings from U.S. tech stocks and increased optimism of imminent Fed rate cuts fuelled pullbacks and a rotation from large-cap stocks towards interest rate-sensitive assets. Meanwhile, Trans-Tasman markets performed strongly, with New Zealand shares and property surging in July, bolstered by the prospect of interest rates coming down faster than expected. Australian shares weren’t far behind, benefitting from a positive inflation outcome.
July started off strong with more record highs, but major pullbacks occurred as the month progressed.
Global Markets Summary: July 2024
Global equity markets saw a roller-coaster ride over the month but ultimately still finished higher. Investors became concerned about concentration risk in the market amongst a handful of mega-cap companies, who need to increasingly meet high hurdles to justify their lofty valuations. This helped fuel a rotation toward previously unloved corners of the market, such as small caps, defensive names and value stocks. Small and mid-cap stocks outperformed their large-cap counterparts significantly, closing most of the performance gap year-to-date, which led to one of the largest one-month outperformance of the Russell 2000 (small-cap index) versus the tech-heavy NASDAQ-100 index in over 20 years. Overall, the MSCI All Country World Index finished the month of July +1.3% higher in NZD-hedged terms, while being much stronger in unhedged terms, up +4.2% due to further NZD weakness.
July saw a rotation from large-cap and growth stocks to the previously unloved small-cap and value stocks.
US stocks finish the month marginally higher, but the positive return obscures significant volatility over July. From the beginning of the year until the last week of July, the S&P 500 maintained a remarkably consistent upward trajectory en route to setting 38 all-time closing records. The S&P 500 also went over 350 trading sessions without a 2% drop – its longest streak in over 17 years. However, on July 24th, US stocks suffered their worst decline since December 2022, falling -2.3% following lacklustre earnings results from ‘Magnificent Seven’ constituents Tesla and Alphabet. This fuelled a wider sell-off in tech stocks, with the NASDAQ slumping -3.6% that day (its fifth 2%+ daily decline this year) and finishing the month -0.7% lower.
The rotation away from mega-cap tech names resulted from a ‘perfect storm’ of AI pessimism and encouraging economic data that all but solidified the prospect of imminent rate cuts. Investors have become increasingly sceptical about whether the avalanche of money tech companies have been pouring into building AI infrastructure will actually translate into outsized future profits. Meanwhile, stronger than expected annualised GDP growth of 2.8% in the US, coupled with US inflation easing to 3.0% year-on-year has led to markets earmarking September for the Federal Reserve to kick-start its rate easing cycle. Against this backdrop, a shift to the broader market seemed to be the trade of choice for investors.
Another catalyst for these market movements has been political developments that ramped up in July. A poor showing by Biden at the first presidential debate, followed by the failed assassination attempt on Trump, put the former president in pole position to win the November elections. This ignited the ‘Trump Trade’, which favours smaller, domestically orientated firms and ‘old economy’ industries at the expense of large tech companies, reflecting Trump’s policies on corporate tax cuts and higher tariffs. However, Trump’s probability of becoming the next US President dropped significantly, from approximately 70% to 50%, following the news that Kamala Harris will replace Joe Biden as the Democratic nominee. This led to a stabilisation of markets, which priced in a lower risk of Trump’s more inflationary fiscal policy.
Financial markets were shaken in July as political action heated up in the US with the upcoming elections.
Eurozone shares notched a small gain in July, but lagged their US and UK counterparts, with the MSCI Europe ex-UK Index returning +0.6% over the month. While Eurozone GDP growth was positive at +0.3% quarter-on-quarter in Q2, other data releases were less rosy. Germany saw a -0.1% fall in GDP and the Eurozone Purchasing Managers’ Index (PMI), which surveys the activity of companies in the manufacturing and service sectors indicated that the eurozone economy was near stagnation. This mixed economic data, combined with the uncertainty of the French parliamentary election (where no political group achieved an outright majority) tempered market performance. Meanwhile, the European Central Bank (ECB) kept interest rates on hold over the month, although ECB Governor Lagarde noted another cut in September was wide open and data dependent. This was as eurozone inflation for July was forecasted to increase slightly to 2.6%, up 0.1% from June.
UK shares performed well over the month amid stronger than expected economic growth, with the FTSE 100 rising +2.5% in July, despite headwinds of a strong currency impacting the sterling value of overseas earnings. The landslide Labour general election victory early in the month helped fuel hopes for a sustained recovery in the economy, which were further bolstered by economic surveys showing business confidence and activity had picked up markedly in July. With annual inflation holding steady at 2.0%, investor attention is now focused on the timing and quantum of the Bank of England’s rate easing cycle.
Japanese shares were volatile over the month, hitting record highs in early July, but finishing lower with the TOPIX index returning -0.5%. The decline was driven by the wider pullback in AI and tech stocks as well as pressure from a strengthening yen. Earlier than expected Fed rate cuts, coupled with a surprise 15 bps Bank of Japan rate hike to 0.25%, led to the yen surging 6.5% against the US dollar in July – its strongest monthly move since 2016. Exporters such as those in Japan’s auto, technology and machinery industries were weighed down by the strengthening yen’s negative impact on profits, but more defensive sectors such as pharmaceuticals, foods and construction supported the Japanese market during a turbulent July.
The Bank of Japan surprised markets by rising rates for only the second time since 2007.
Wider Asian and Emerging markets were mixed in July, with stocks in Taiwan (-3.6%) and Korea (-1.0%) badly hit by the sell-off in technology stocks, although Taiwan remains the best-performing Asia-Pacific index market year-to-date. The Chinese equity market also struggled, falling -1.2% due to continued challenges in the real estate sector and its spillover impact on the broader economy, which grew at just 4.7% year-on-year over Q2 (towards the lower end of the official target). Chinese authorities did however implement measures to provide more liquidity to the financial system to stimulate lending and growth. The poor performance of index heavyweights China and Taiwan saw emerging markets lag their developed counterparts, although India, Brazil and Mexico were lone bright spots for emerging market indices.
Global bonds saw a positive month in July, with government bond yields (which move inversely to bond prices) dropping across major markets, propelled by easing inflation and expected interest rate cuts. The start of any rate-cutting cycle is crucial for bond markets, so central banks were again centre stage. The US Federal Reserve held rates again in July for seemingly the last time, with Fed Chair Powell steering markets towards a September rate cut amid lower inflation and weak labour market data. Upcoming rate cuts from the European Central Bank and Bank of England are also on market watcher’s bingo cards. Overall, this saw the Bloomberg Global Aggregate Bond Index hedged to the NZD return +2.0% in July.
Key updates for the Kiwi investor:
The New Zealand share market hit a 30-month high and recorded its strongest month of the year in July, with the S&P/NZX 50 Gross Index (with imputation credits) returning +5.8% over the month. Out of the NZX 50, 43 companies reported positive returns, as the local market benefited from softening inflation, which came in at an annual rate of just 3.3% over Q2, down from 4.0% in Q1 and less than half of the 7.3% peak in 2022. This inflation reading certainly surprised on the downside and was materially below the 3.6% that the Reserve Bank of New Zealand (RBNZ) had pencilled in at this stage and just shy of the RBNZ’s 1-3% target range. This supported the prospect of sooner-than-expected interest rate cuts, which is a boon for the more interest rate sensitive local market. The New Zealand share market was also bolstered by corporate activity, with private equity firms making takeover offers for retirement village operator Arvida Group, which was up a staggering +74% in July.
The New Zealand market was bolstered by inflation retreating to 3.3% – just shy of the RBNZ’s 1-3% target.
Local bond markets also impressed in July, with the Bloomberg NZBond Composite 0+ Yr Index returning +2.3% over the month. Longer-term interest rates drifted lower amid global events and ongoing weakness in domestic economic data, with the New Zealand 10-year yield falling 33 bps to end at 4.35%. Despite the RBNZ holding rates steady again in July, there was a clear dovish pivot or softening in their tone and outlook for the OCR going forward. The market expectations of future OCR levels changed markedly over the month with softening inflation and weak economic data. At the beginning of July, the market had forecasted the OCR would be 4.7% in one year’s time, while the end of July saw the market price in an OCR of 3.7% in one year’s time – a full 1.0% lower.
Market expectations of the OCR dropped significantly over July amid a dovish pivot from the RBNZ.
What a difference a couple of months makes as the RBNZ has seemingly flip-flopped on their OCR track. In their May policy review meeting, the RBNZ had not pencilled in rate cuts until mid-2025 at earliest, and even discussed the prospect of increasing rates! While the result of their July meeting was the same as May (a hold), there was no rate hike discussed in July, and instead, the Bank noted that “tight monetary policy is feeding through to domestic demand more strongly than expected1”. The RBNZ’s biggest hint toward an earlier start to the rate easing cycle was an acknowledgement that while monetary policy needs to remain restrictive, the extent will be tempered as inflation pressures decline.
The RBNZ has likely realised they are behind the curve, as many find it hard to believe that the NZ economy could have changed so significantly in the two months between the monetary policy decisions. The RBNZ is now likely looking to make up for lost time, which history shows they aren’t afraid to do. With three easing cycles within a 10-year span ending with the Global Financial Crisis, the RBNZ has a track record of aggressively cutting interest rates when necessary – could we see more of the same in this upcoming rate easing cycle?
With a history of aggressively cutting rates, the RBNZ appears ready to make up for lost time in 2024.
Chart of the month:
Lighthouse highlights that while sizable pullbacks often occur during the year, more often than not the full year returns are well worth seeing through any intra-year volatility.
Our Chart of the Month is from Lighthouse Funds, with data from J.P. Morgan, which contrasts the hefty intra-year drops the S&P 500 can often experience against the strong full-year returns on offer. Dating back nearly 50 years, the S&P 500 experienced an average pullback during the year of -14.2%. While it can be nerve-racking to see your portfolio drop by nearly 15% during the year and tempting to switch over to something more conservative to soften the blow, an investor who remains invested for the full year ends up generating a positive return of 75% of the time.
Lighthouse highlights that drawdowns and volatility are a regular market reality – historically, small pullbacks of 5-10% occur several times a year, while larger corrections with a 10-15% fall happen about once a year. Meanwhile, bear markets (with a more than 20% fall) might happen every 3 years or so, with the last one in 2022, while market crashes of 30% or more might happen every decade (e.g. 2000 dotcom, 2008 GFC and 2020 Covid crash). Yet despite this, the annual return of the S&P 500 has been over 10% p.a., with investors who stayed on course year-in and year-out being handsomely rewarded.
If they happen so often, how can investors best avoid market falls? Lighthouse offers this simple rule of thumb: more money has been lost trying to avoid corrections and bear markets than has actually been lost in corrections and bear markets. While investors can opt for more conservative investment options that provide a smoother ride, this typically comes at the cost of higher long-term returns. If you have a multi-year investment horizon, then sacrificing performance to avoid daily or monthly swings often results in giving up sizable returns just so you can feel better along the way.
Lighthouse emphasises that for most investors, the key organ is the stomach, not the brain. If you can tolerate pullbacks, corrections, bear markets and crashes, then history tells us that equity investing will deliver superior long-term returns.
1OCR 5.50% – Inflation Approaching Target Range – Reserve Bank of New Zealand – Te Pūtea Matua (rbnz.govt.nz)
2July 2024 Market Wrap up with Lighthouse Funds
What we’ve been reading:
- Dexus: Global REITs – The Most Attractive Sub-sectors
- Franklin Templeton: Central Banks – Will inflation stay, or will it go?
- Harbour: Top 10 Risks and Opportunities for 2024 – A Mid-Year Reflection
- Milford: Trust Tax Changes this Year – Worth Another Look at Investment Fund PIEs
- Mint: Are NZ Equities a Buy?
- Morningstar: KiwiSaver Survey | June Quarter 2024
- Nikko: The Future Isn’t What it Was
- Octagon: Cash is Not Always King
- Pathfinder: Shop Local, Invest Local
- Squirrel: Greater Competition in Banking Starts with a Fairer Rate on Kiwi Savings