

Focus on what matters
Article written by Lighthouse Funds
Key Points:
- Focus on net returns after tax – that’s what you get to keep
- Differences in fees are quickly overwhelmed by differences in investment style
- The best measure of a manager’s inherent performance is the 5-year average net returns
Focus On What You Get To Keep
There’s a lot of focus on fund management fees, with both regulatory and competitive pressure to keep fees low. The implication is that lower fees will result in higher returns to investors, but fees are just one of the inputs in determining the returns you will receive as an investor.
What really matters isn’t fees but net returns after tax – because that’s what you, the investor, get to keep. In particular what matters is net returns after tax over medium- to long-term horizons. Any fund manager can fluke one good year, so you should focus on their average net returns after tax across three year and five year periods.
Fees Are Only One Input Into Net Returns After Tax
It seems the accepted wisdom is that the only difference between competing funds is their level of fees, and so lower fees will surely result in higher returns to investors.
That may be true within directly comparable passively managed funds – if you have two competing NZX50 index tracking funds then yes the difference between their fees will be important. But other than that narrow situation the other differences between funds will overwhelm the relatively small differences in fees.
Base fees can range from as low as 0.1% pa for very large passively-managed funds through to as much as 1.5% pa for some actively-managed equity funds, but most funds have base fees in the range of 0.6%-1.1% pa. So the difference in base fees between two ostensibly comparable funds is likely no more than 0.5% pa.
But the difference in gross returns between funds, even within the same asset class, can be much higher than 0.5% pa. MJW’s excellent quarterly investment surveys show you the gross returns (the returns before fees and tax) for about 200 investment funds and for all the KiwiSaver providers. Their most recent survey, for the June 2021 quarter, shows variability in the 5-year gross returns of:
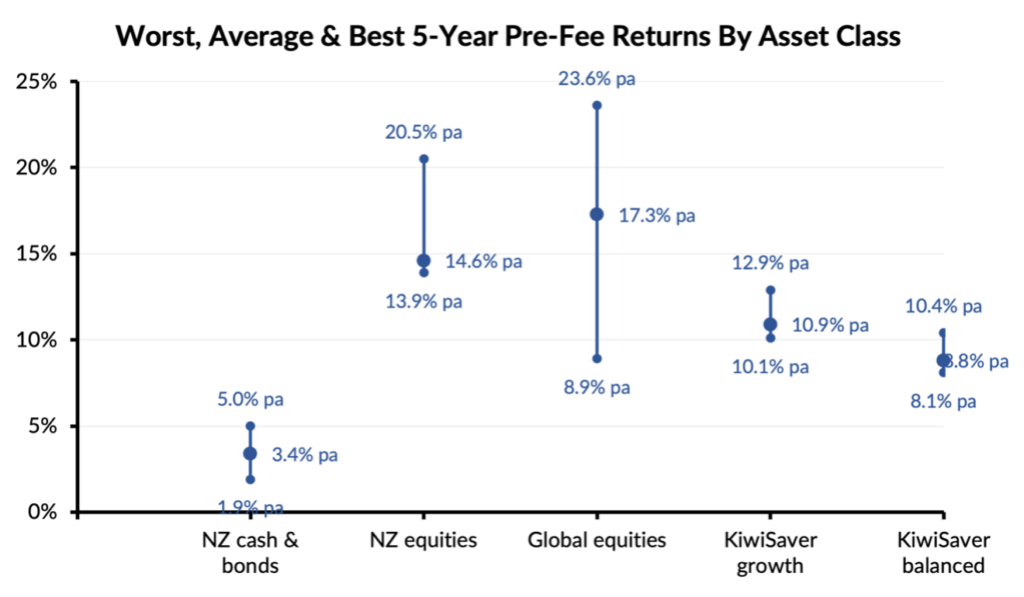
Pragmatically, the differences in gross returns due to differing fund manager styles, strategies and execution will almost certainly outweigh any small differences in their fees. Basing your choice of a global equity fund on a 0.5% pa differences in base fees seems mis-directed when there’s a 14% pa difference in gross returns between the best and worst managers. Our grandparents’ generation used to call that being “penny wise, pound foolish”.
Added to which there can be material differences in the effective tax rates between funds too, as different portfolio compositions lead to different levels of taxable income. A 28% PIR investor can easily find that the difference in the tax they would pay on two apparently comparable funds can equate to more than 1% pa.
Comparing on fees is appealing because it’s simple, but looking for the lowest fees won’t capture these other factors. But the differences in gross performance, in fees and in tax are all captured when you compare funds on the basis of their net returns after tax.
Focus On The Signal, Not The Noise
Every investment manager has a style and a strategy – it’s the way that they think about finance and investing and it guides and shapes their investment choices. Some managers are very conservative but others are more aggressive, some have concentrated portfolios while others have very widely spread portfolios, and so on.
We believe that each style and strategy has an inherent level of return, and that that inherent level of return will be clear across the long run. But in the short-term there will be times when any given style outperforms, and other patches where it underperforms. The market is constantly moving and the changing conditions align, or not, with certain styles of investing at different times.
In engineering there’s the idea of a signal-to-noise ratio. The signal is the information you want, and the noise is the background interference. We’re all familiar with signal-to-noise ratios in the real world, from trying to tune a radio to a particular station.
Well there’s a signal-to-noise ratio in investing too. The inherent level of return of the manager’s investment style and strategy is the signal. For you the investor that is the information you want to understand. But the noise is the short-term volatility – the shorter good and bad patches as the market briefly aligns, or not, with each strategy.
So how can we best tune out the noise and discern the signal?
Look At The Net Returns Over 3-Year And 5-Year Hold Periods
If you want to see how effective a fund manager’s style and strategy is then you need to look at their fund’s net returns over long hold periods. Shorter hold periods have a lot of noise, but that fades away as you look at longer timeframes.
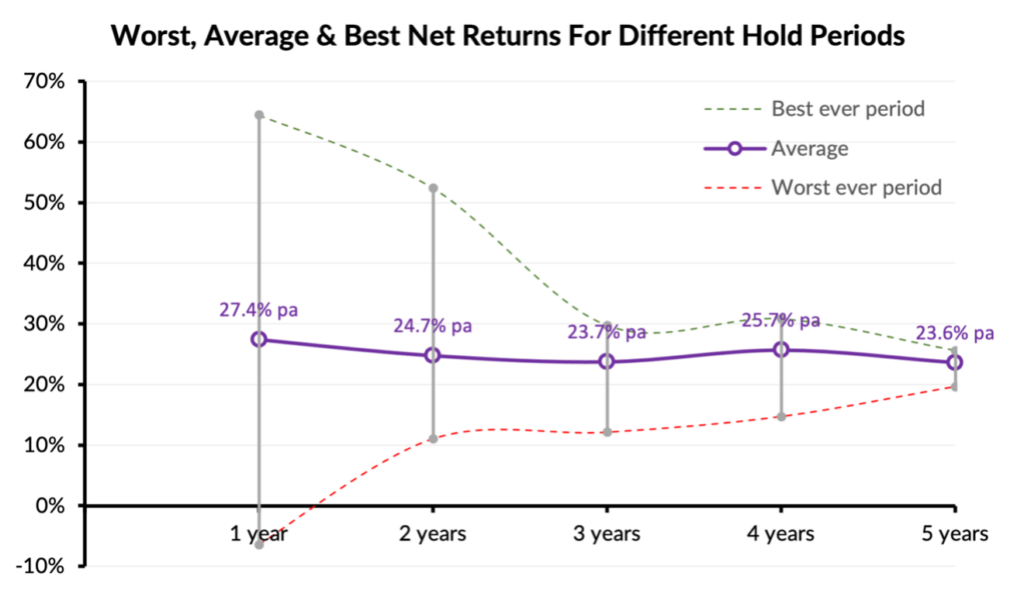
You can see this in the chart below. The chart shows our Lighthouse Global Equity Fund’s best, worst and average returns across hold periods from 1 year to 5 years. The purple line in the middle shows the average returns per annum and you’ll see it’s pretty consistent across the range of hold periods. That is the signal you’re trying to discern.
But if you look at the shorter periods, like 1-year or 2-year holds, then there’s a wide range between the best ever and worst ever returns. That “noise” makes it hard to discern the signal. You could look at the annual (1-year) returns for each of the last five years and they’ll show that wide variability, making it less than obvious what net returns to reasonably expect.
However, once the hold period gets to 3-years and longer that spread between the best and worst ever periods has narrowed, and by the time you get to the 5-year numbers the range is quite tight. The wide variability you see from year-to-year has been squeezed out and what’s left is a clearer picture.
Summing Up – Focus On Net Returns Across 3-Year And 5-Year Periods
When you’re selecting funds to invest in look at their average net returns across long periods. That is the most reliable indicator of what you, the investor, are likely to receive if you invest with them.
The size of the fee is a distraction. You get to keep the net returns after tax. The small differences in fees between managers (realistically 0.5% pa at most) are overwhelmed by the big differences in gross returns between managers (typically at least a 5% pa range between the best and worst performers). Focussing on fees is being penny wise, pound foolish.
But when you look at net returns prioritise the 5-year average net returns. Across that sort of timespan the fund manager’s good and bad patches have balanced out and you’re starting to see the inherent performance of their style and approach. That will be the best guide of the net return you are likely to receive from that fund manager if you invest with them.
Note: The content provided here is written by us, Lighthouse Funds, as general information that we trust is helpful and informative. It’s based on information that we believe to be accurate and reliable, although we can’t guarantee that this is the case. It isn’t intended to be personalised advice for any investor, or class advice for any group of investors. We recommend that before entering into any investment you first seek advice from a financial advisor who can give you professional advice that takes into account your objectives, needs, financial situation and circumstances. Please see our disclaimer.
Focus on what matters
Article written by Lighthouse Funds
Key Points:
- Focus on net returns after tax – that’s what you get to keep
- Differences in fees are quickly overwhelmed by differences in investment style
- The best measure of a manager’s inherent performance is the 5-year average net returns
Focus On What You Get To Keep
There’s a lot of focus on fund management fees, with both regulatory and competitive pressure to keep fees low. The implication is that lower fees will result in higher returns to investors, but fees are just one of the inputs in determining the returns you will receive as an investor.
What really matters isn’t fees but net returns after tax – because that’s what you, the investor, get to keep. In particular what matters is net returns after tax over medium- to long-term horizons. Any fund manager can fluke one good year, so you should focus on their average net returns after tax across three year and five year periods.
Fees Are Only One Input Into Net Returns After Tax
It seems the accepted wisdom is that the only difference between competing funds is their level of fees, and so lower fees will surely result in higher returns to investors.
That may be true within directly comparable passively managed funds – if you have two competing NZX50 index tracking funds then yes the difference between their fees will be important. But other than that narrow situation the other differences between funds will overwhelm the relatively small differences in fees.
Base fees can range from as low as 0.1% pa for very large passively-managed funds through to as much as 1.5% pa for some actively-managed equity funds, but most funds have base fees in the range of 0.6%-1.1% pa. So the difference in base fees between two ostensibly comparable funds is likely no more than 0.5% pa.
But the difference in gross returns between funds, even within the same asset class, can be much higher than 0.5% pa. MJW’s excellent quarterly investment surveys show you the gross returns (the returns before fees and tax) for about 200 investment funds and for all the KiwiSaver providers. Their most recent survey, for the June 2021 quarter, shows variability in the 5-year gross returns of:
Pragmatically, the differences in gross returns due to differing fund manager styles, strategies and execution will almost certainly outweigh any small differences in their fees. Basing your choice of a global equity fund on a 0.5% pa differences in base fees seems mis-directed when there’s a 14% pa difference in gross returns between the best and worst managers. Our grandparents’ generation used to call that being “penny wise, pound foolish”.
Added to which there can be material differences in the effective tax rates between funds too, as different portfolio compositions lead to different levels of taxable income. A 28% PIR investor can easily find that the difference in the tax they would pay on two apparently comparable funds can equate to more than 1% pa.
Comparing on fees is appealing because it’s simple, but looking for the lowest fees won’t capture these other factors. But the differences in gross performance, in fees and in tax are all captured when you compare funds on the basis of their net returns after tax.
Focus On The Signal, Not The Noise
Every investment manager has a style and a strategy – it’s the way that they think about finance and investing and it guides and shapes their investment choices. Some managers are very conservative but others are more aggressive, some have concentrated portfolios while others have very widely spread portfolios, and so on.
We believe that each style and strategy has an inherent level of return, and that that inherent level of return will be clear across the long run. But in the short-term there will be times when any given style outperforms, and other patches where it underperforms. The market is constantly moving and the changing conditions align, or not, with certain styles of investing at different times.
In engineering there’s the idea of a signal-to-noise ratio. The signal is the information you want, and the noise is the background interference. We’re all familiar with signal-to-noise ratios in the real world, from trying to tune a radio to a particular station.
Well there’s a signal-to-noise ratio in investing too. The inherent level of return of the manager’s investment style and strategy is the signal. For you the investor that is the information you want to understand. But the noise is the short-term volatility – the shorter good and bad patches as the market briefly aligns, or not, with each strategy.
So how can we best tune out the noise and discern the signal?
Look At The Net Returns Over 3-Year And 5-Year Hold Periods
If you want to see how effective a fund manager’s style and strategy is then you need to look at their fund’s net returns over long hold periods. Shorter hold periods have a lot of noise, but that fades away as you look at longer timeframes.
You can see this in the chart below. The chart shows our Lighthouse Global Equity Fund’s best, worst and average returns across hold periods from 1 year to 5 years. The purple line in the middle shows the average returns per annum and you’ll see it’s pretty consistent across the range of hold periods. That is the signal you’re trying to discern.
But if you look at the shorter periods, like 1-year or 2-year holds, then there’s a wide range between the best ever and worst ever returns. That “noise” makes it hard to discern the signal. You could look at the annual (1-year) returns for each of the last five years and they’ll show that wide variability, making it less than obvious what net returns to reasonably expect.
However, once the hold period gets to 3-years and longer that spread between the best and worst ever periods has narrowed, and by the time you get to the 5-year numbers the range is quite tight. The wide variability you see from year-to-year has been squeezed out and what’s left is a clearer picture.
Summing Up – Focus On Net Returns Across 3-Year And 5-Year Periods
When you’re selecting funds to invest in look at their average net returns across long periods. That is the most reliable indicator of what you, the investor, are likely to receive if you invest with them.
The size of the fee is a distraction. You get to keep the net returns after tax. The small differences in fees between managers (realistically 0.5% pa at most) are overwhelmed by the big differences in gross returns between managers (typically at least a 5% pa range between the best and worst performers). Focussing on fees is being penny wise, pound foolish.
But when you look at net returns prioritise the 5-year average net returns. Across that sort of timespan the fund manager’s good and bad patches have balanced out and you’re starting to see the inherent performance of their style and approach. That will be the best guide of the net return you are likely to receive from that fund manager if you invest with them.
Note: The content provided here is written by us, Lighthouse Funds, as general information that we trust is helpful and informative. It’s based on information that we believe to be accurate and reliable, although we can’t guarantee that this is the case. It isn’t intended to be personalised advice for any investor, or class advice for any group of investors. We recommend that before entering into any investment you first seek advice from a financial advisor who can give you professional advice that takes into account your objectives, needs, financial situation and circumstances. Please see our disclaimer.
Leave A Comment