
InvestNow News – 11th December – Franklin Templeton – DECODING CHINA’S RATE MARKET CONUNDRUM
Article written by Tracy Chen, Franklin Templeton – 26th October 2020
Brandywine Global: We assess the true indicators of the PBOC monetary stance, reasons for the market rate selloff, and whether China’s onshore bonds offer value.
With China’s policymakers’ resolve to attract foreign capital to its onshore bond market and the country’s gradual inclusion in global bond indices, foreign investors are assessing the merits of investing in that market. Unfortunately, the market is sending mixed signals on whether monetary conditions are easing or beginning to tighten. China’s onshore rate market has been selling off since April, but at the same time credit growth has been expanding. Is the V-shaped recovery to blame for the selloff or are there are other factors at work? What is our expectation for China’s local rates going forward? Here, we assess the true indicators of the People’s Bank of China’s (PBOC) monetary stance, reasons for the market rate selloff, and whether China’s onshore bonds offer value.
THE WEAK LINK BETWEEN BOND YIELDS AND GDP GROWTH
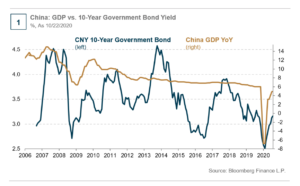
For most developed countries, government bond yields, due to their safe-haven nature and monetary transmission function, serve as a growth barometer. However, China’s government bond yield has not correlated with the country’s gross domestic product (GDP) growth. Instead, the 10-year government bond yield has hardly changed from its 2005 level even though China’s year-over-year GDP growth declined significantly to a low single-digit level from double-digit growth (see Chart 1). This anomaly indicates China’s bond market valuation is far from market-driven and suggests other policy levers are at play in transmitting to the real economy. The PBOC utilizes various levers to control the rate market, including quantitative methods, such as loan quotas and liquidity injections; open market operations, like controlling medium-term liquidity funding (MLF) or short-term liquidity funding (SLF); and regulation or administrative measures, such as directing bank lending to small- and medium-sized enterprises (SME), shadow banking crackdown, targeted easing, etc. We will discuss these tools below.

THE AMBIVALENT MONETARY STANCE
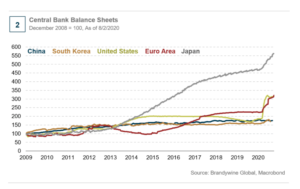
China’s monetary policy differentiates the PBOC from other major central banks. As other central banks gravitated to the zero lower bound and released the floodgate of quantitative easing to support economies post-COVID, the PBOC has eased more modestly this year and even assumed a more hawkish stance recently (see Chart 2). Market interest rates have risen since April and have remained high despite the government’s repeated guidance on lower funding costs. At the same time, credit growth has continued to pick up. Has monetary policy started its tightening phase? Various market rates say “yes” and but the government’s boost to the credit impulse says “no.”
ASSESSING INDICATORS OF MONETARY STANCE AGAINST HISTORICAL PERSPECTIVE
Amid the confusing signals, what is the most accurate way to gauge the PBOC’s actual monetary policy stance? The PBOC’s historical use of monetary tools over recent years should provide contexts and offer some clues:
- Along with China’s structural shift from an export-driven growth model to a more domestic consumption-driven one, foreign currency reserve inflows have not been an important driver of money supply since 2014. The PBOC’s balance sheet expansion has been driven mainly by open market operations via instruments like MLF and SLF, i.e., collateralized lending to banks.
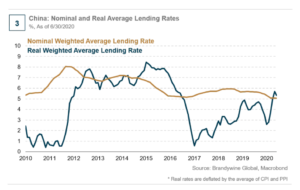
- China’s deleveraging drive in 2017-2018 squeezed interest rates higher through the tightening of bank lending to non-bank financial institutions (NBFI). This campaign soaked up liquidity in the interbank market, which raised real interest rates (see Chart 3).
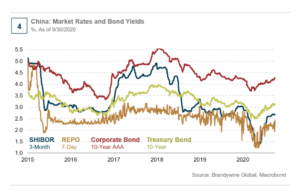
- With the goal to offset the negative impact of the U.S.-China trade war, the PBOC started to ease monetary policy in 2018 by increasing liquidity injections. The easing efforts further strengthened in early 2020 to offset the shock of COVID-19 and led to the decline in market rates, like 7-day repo rates and bond yields (see Chart 4). However, rates have resumed their rise since April 2020.
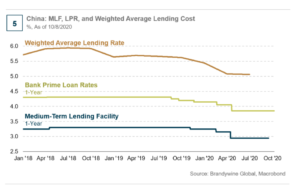
- Credit growth accelerated with average financing costs declining in 2019-2020. The loan prime rate (LPR) was launched in late 2019 as the new benchmark lending rate to facilitate the transmission of monetary easing to the real economy, although this rate is based on MLF rates (see Chart 5). Despite the severe negative impact of COVID-19, the PBOC refrained from expanding its balance sheet like other central banks. Instead, its large liquidity injections in early 2020 were mostly withdrawn in later months, and its dry powder was retained to stimulate if needed in the future.
THE DIVERGENCE OF MARKET RATES AND LENDING RATES
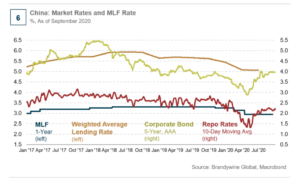
Now, here comes the conundrum of why market rates and benchmark lending rates are currently diverging. The former is rising while the latter is stabilizing at a lower level, sending confusing signals on China’s monetary stance. This divergence also happened in 2018-2019 when the PBOC injected liquidity and cut the reserve requirement ratio (RRR), sending short-term rates lower while MLF rates stayed unchanged. This time around, although the government reiterated its focus on lowering funding costs to corporates with MLF unchanged, bond yields moved up significantly since April together with short-term repo rates (see Chart 6). More surprisingly, the PBOC refrained from injecting more liquidity to contain the sharp increase in short-term rates and bond yields. The market regards the PBOC’s tolerance of higher market rates as a tightening signal of monetary conditions.
THE BEST INDICATOR OF MONETARY STANCE
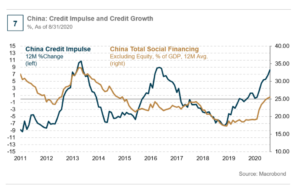
China’s monetary policy still relies more heavily on quantitative and administrative/regulatory instruments than merely just price tools. In addition to the liquidity operations and short-term and medium-term rates adjustments, the PBOC and other regulatory authorities also resort to regulatory measures and window guidance to influence credit quantity and channel direction. These may include credit controls or support to specific sectors, loan quotas, and easing or tightening of access to loans, the bond market, or shadow credit. As a result, the best indicator to gauge the monetary stance is through monitoring credit growth and credit impulse (see Chart 7). With liquidity easing starting in mid-2018, market interest rates dropped and credit growth along with credit impulse bottomed in late 2018. Both then rebounded sharply in 2020. In the same vein, while market rates have increased since April 2020, credit growth has continued to accelerate. Indeed, with China’s growth gradually normalizing, the PBOC’s focus seems to be shifting to containing a potential asset bubble and financial risks, demonstrated by its effort to rein in the leverage of the property market. We expect credit growth and credit impulse to peak in October or November of this year.
RELATIVE VALUE OF CHINA’S GOVERNMENT BONDS
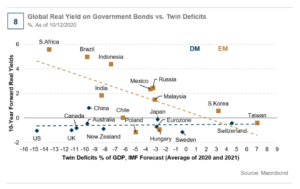
As a result of the unique monetary policy intervention through a combination of tools, it is hard to build a valuation model to calibrate the fair value of China’s government bonds. However, we can use the following metrics to assess their relative value to both developed and emerging market bonds (see Chart 8).
From a cross-market government bond valuation perspective, it really depends whether you prefer to compare China with developed markets or emerging markets (EM). For EM, there is a pattern where investors demand higher real yields for countries with higher twin deficits, e.g., Indonesia, Brazil, and South Africa. In this metric, China’s real yield at slightly above zero is not particularly high (see Chart 8). However, if the comparable market is developed market bonds, then China is very attractive since virtually all these government bonds offer negative real yields today. Indeed, over the past three to four years, the significant portion of foreign inflows into Chinese government bonds are from reserve allocations into yuan-denominated assets from sovereign wealth funds and central banks.
CONCLUSION
The PBOC utilizes multiple tools to control monetary policy. In addition to pricing control, quantitative and regulatory or administrative measures are important parts of its tool kit. To gauge the PBOC’s monetary stance for China’s real economy, we should focus more on credit growth and credit impulse rather than just looking at market rates. So far, the PBOC has been tolerating the divergence of market rates and benchmark rates. We do not expect the PBOC to inject liquidity to contain the rate rise as economic activities continue to recover. In addition, we believe caution around a potential asset price bubble and financial risk will restrain the PBOC from easing. Market rates should be range-bound or rise slightly until the end of 2020 as growth further picks up. However, rates should stabilize at a reasonably low level in 2021 given China’s high debt level and slower structural growth.
We believe the current selloff in China’s onshore sovereign bond market has limited further room to run, given its already higher rate differentials relative to the rate markets of developed market countries. Chinese bonds look cheaper than developed market bonds while offering stability and better fundamentals compared to other EM bonds.
DEFINITIONS
A V-shaped recovery is characterized by a quick and sustained recovery in measures of economic performance after a sharp economic decline. Because of the speed of economic adjustment and recovery in macroeconomic performance, a V-shaped recovery is a best case scenario given the recession.
The People’s Bank of China (PBC or PBOC) is the central bank of the People’s Republic of China with the power to control monetary policy and regulate financial institutions in mainland China.
Gross Domestic Product (“GDP”) is an economic statistic which measures the market value of all final goods and services produced within a country in a given period of time.
A safe haven is an investment that is expected to retain or increase in value during times of market turbulence. Safe havens are sought by investors to limit their exposure to losses in the event of market downturns.
Shadow banking refers to financial intermediaries involved in facilitating the creation of credit across the global financial system, but whose members are not subject to regulatory oversight.
Funding liquidity is the availability of credit to finance the purchase of financial assets.
Quantitative easing (QE) refers to a monetary policy implemented by a central bank in which it increases the excess reserves of the banking system through the direct purchase of debt securities.
Zero lower bound is the lower limit that rates can be cut to, but no further. When this level is reached, and the economy is still underperforming, then the central bank can no longer provide stimulus via interest rates.
COVID-19 is the World Health Organization’s official designation of the current novel coronavirus disease. The virus causing the novel coronavirus disease is known as SARS¬CoV-2.
Quantitative tightening (QT) refers to a monetary policy implemented by a central bank in which it reduces the excess reserves of the banking system through the direct sale of debt securities from its own inventory.
The Shanghai Interbank Offered Rate (or Shibor, is a daily reference rate based on the interest rates at which banks offer to lend unsecured funds to other banks in the Shanghai wholesale (or “interbank”) money market.
A corporate bond is a bond issued by a corporation in order to raise financing for a variety of reasons such as to ongoing operations, M&A, or to expand business.
Treasury bonds are government debt securities to finance government spending as an alternative to taxation.
The notion of Credit Impulse has been introduced for the first time by Michael Biggs in November 2008. It represents the flow of new credit issued from the private sector as a percentage of GDP. It is considered as the second derivative of credit growth and arguably the biggest driver behind economic growth.
The medium-term lending facility (MLF) and standing lending facility (SLF) are monetary policy tools established by the PBOC to offer collateralized loans to banks. SLF loans have a shorter maturity and differs from the MLF, which the PBOC uses to manage longer-term liquidity in the banking system.
Repo is a form of short-term borrowing for dealers in government securities.
LPR (Loan Prime Rate) is the most preferential lending rate offered by a commercial bank to its prime clients, and other lending rates can be offered by adding or subtracting basis points based on it.
The reserve requirement ratio (RRR) is the percentage of depositors’ balances banks must have on hand as cash.
Developed markets refers to countries that have sound, well-established economies and are therefore thought to offer safer, more stable investment opportunities than developing markets.
Emerging markets (EM) are nations with social or business activity in the process of rapid growth and industrialization. These nations are sometimes also referred to as developing or less developed countries.
Sovereign wealth funds are pools of money derived from a country’s reserves, which are set aside for investment purposes for the benefit of the country’s economy and citizens.
The International Monetary Fund (IMF) is an international organization of various member countries, established to promote international monetary cooperation, exchange stability, and orderly exchange arrangements.
The twin deficit, or double deficit, occurs when a nation has both a current account deficit and a budget deficit. This means the country’s economy is importing more than it is exporting, and the country’s government is spending more money than it is generating.
WHAT ARE THE RISKS?
Past performance is no guarantee of future results. Please note that an investor cannot invest directly in an index. Unmanaged index returns do not reflect any fees, expenses or sales charges.
Equity securities are subject to price fluctuation and possible loss of principal. Fixed-income securities involve interest rate, credit, inflation and reinvestment risks; and possible loss of principal. As interest rates rise, the value of fixed income securities falls. International investments are subject to special risks including currency fluctuations, social, economic and political uncertainties, which could increase volatility. These risks are magnified in emerging markets. Commodities and currencies contain heightened risk that include market, political, regulatory, and natural conditions and may not be suitable for all investors.
U.S. Treasuries are direct debt obligations issued and backed by the “full faith and credit” of the U.S. government. The U.S. government guarantees the principal and interest payments on U.S. Treasuries when the securities are held to maturity. Unlike U.S. Treasuries, debt securities issued by the federal agencies and instrumentalities and related investments may or may not be backed by the full faith and credit of the U.S. government. Even when the U.S. government guarantees principal and interest payments on securities, this guarantee does not apply to losses resulting from declines in the market value of these securities.
IMPORTANT LEGAL INFORMATION
This material is intended to be of general interest only and should not be construed as individual investment advice or a recommendation or solicitation to buy, sell or hold any security or to adopt any investment strategy. It does not constitute legal or tax advice.
The views expressed are those of the investment manager and the comments, opinions and analyses are rendered as at publication date and may change without notice. The information provided in this material is not intended as a complete analysis of every material fact regarding any country, region or market. All investments involve risks, including possible loss of principal.
Data from third party sources may have been used in the preparation of this material and Franklin Templeton (“FT”) has not independently verified, validated or audited such data. FT accepts no liability whatsoever for any loss arising from use of this information and reliance upon the comments opinions and analyses in the material is at the sole discretion of the user.
Products, services and information may not be available in all jurisdictions and are offered outside the U.S. by other FT affiliates and/or their distributors as local laws and regulation permits. Please consult your own financial professional or Franklin Templeton institutional contact for further information on availability of products and services in your jurisdiction.
Issued in the U.S. by Franklin Templeton Distributors, Inc., One Franklin Parkway, San Mateo, California 94403-1906, (800) DIAL BEN/342-5236, franklintempleton.com – Franklin Templeton Distributors, Inc. is the principal distributor of Franklin Templeton U.S. registered products, which are not FDIC insured; may lose value; and are not bank guaranteed and are available only in jurisdictions where an offer or solicitation of such products is permitted under applicable laws and regulation.
You need Adobe Acrobat Reader to view and print PDF documents. Download a free version from Adobe’s website.
Franklin Templeton Distributors, Inc.
InvestNow News – 11th December – Franklin Templeton – DECODING CHINA’S RATE MARKET CONUNDRUM
Article written by Tracy Chen, Franklin Templeton – 26th October 2020
Brandywine Global: We assess the true indicators of the PBOC monetary stance, reasons for the market rate selloff, and whether China’s onshore bonds offer value.
With China’s policymakers’ resolve to attract foreign capital to its onshore bond market and the country’s gradual inclusion in global bond indices, foreign investors are assessing the merits of investing in that market. Unfortunately, the market is sending mixed signals on whether monetary conditions are easing or beginning to tighten. China’s onshore rate market has been selling off since April, but at the same time credit growth has been expanding. Is the V-shaped recovery to blame for the selloff or are there are other factors at work? What is our expectation for China’s local rates going forward? Here, we assess the true indicators of the People’s Bank of China’s (PBOC) monetary stance, reasons for the market rate selloff, and whether China’s onshore bonds offer value.
THE WEAK LINK BETWEEN BOND YIELDS AND GDP GROWTH
For most developed countries, government bond yields, due to their safe-haven nature and monetary transmission function, serve as a growth barometer. However, China’s government bond yield has not correlated with the country’s gross domestic product (GDP) growth. Instead, the 10-year government bond yield has hardly changed from its 2005 level even though China’s year-over-year GDP growth declined significantly to a low single-digit level from double-digit growth (see Chart 1). This anomaly indicates China’s bond market valuation is far from market-driven and suggests other policy levers are at play in transmitting to the real economy. The PBOC utilizes various levers to control the rate market, including quantitative methods, such as loan quotas and liquidity injections; open market operations, like controlling medium-term liquidity funding (MLF) or short-term liquidity funding (SLF); and regulation or administrative measures, such as directing bank lending to small- and medium-sized enterprises (SME), shadow banking crackdown, targeted easing, etc. We will discuss these tools below.
THE AMBIVALENT MONETARY STANCE
China’s monetary policy differentiates the PBOC from other major central banks. As other central banks gravitated to the zero lower bound and released the floodgate of quantitative easing to support economies post-COVID, the PBOC has eased more modestly this year and even assumed a more hawkish stance recently (see Chart 2). Market interest rates have risen since April and have remained high despite the government’s repeated guidance on lower funding costs. At the same time, credit growth has continued to pick up. Has monetary policy started its tightening phase? Various market rates say “yes” and but the government’s boost to the credit impulse says “no.”
ASSESSING INDICATORS OF MONETARY STANCE AGAINST HISTORICAL PERSPECTIVE
Amid the confusing signals, what is the most accurate way to gauge the PBOC’s actual monetary policy stance? The PBOC’s historical use of monetary tools over recent years should provide contexts and offer some clues:
- Along with China’s structural shift from an export-driven growth model to a more domestic consumption-driven one, foreign currency reserve inflows have not been an important driver of money supply since 2014. The PBOC’s balance sheet expansion has been driven mainly by open market operations via instruments like MLF and SLF, i.e., collateralized lending to banks.
- China’s deleveraging drive in 2017-2018 squeezed interest rates higher through the tightening of bank lending to non-bank financial institutions (NBFI). This campaign soaked up liquidity in the interbank market, which raised real interest rates (see Chart 3).
- With the goal to offset the negative impact of the U.S.-China trade war, the PBOC started to ease monetary policy in 2018 by increasing liquidity injections. The easing efforts further strengthened in early 2020 to offset the shock of COVID-19 and led to the decline in market rates, like 7-day repo rates and bond yields (see Chart 4). However, rates have resumed their rise since April 2020.
- Credit growth accelerated with average financing costs declining in 2019-2020. The loan prime rate (LPR) was launched in late 2019 as the new benchmark lending rate to facilitate the transmission of monetary easing to the real economy, although this rate is based on MLF rates (see Chart 5). Despite the severe negative impact of COVID-19, the PBOC refrained from expanding its balance sheet like other central banks. Instead, its large liquidity injections in early 2020 were mostly withdrawn in later months, and its dry powder was retained to stimulate if needed in the future.
THE DIVERGENCE OF MARKET RATES AND LENDING RATES
Now, here comes the conundrum of why market rates and benchmark lending rates are currently diverging. The former is rising while the latter is stabilizing at a lower level, sending confusing signals on China’s monetary stance. This divergence also happened in 2018-2019 when the PBOC injected liquidity and cut the reserve requirement ratio (RRR), sending short-term rates lower while MLF rates stayed unchanged. This time around, although the government reiterated its focus on lowering funding costs to corporates with MLF unchanged, bond yields moved up significantly since April together with short-term repo rates (see Chart 6). More surprisingly, the PBOC refrained from injecting more liquidity to contain the sharp increase in short-term rates and bond yields. The market regards the PBOC’s tolerance of higher market rates as a tightening signal of monetary conditions.
THE BEST INDICATOR OF MONETARY STANCE
China’s monetary policy still relies more heavily on quantitative and administrative/regulatory instruments than merely just price tools. In addition to the liquidity operations and short-term and medium-term rates adjustments, the PBOC and other regulatory authorities also resort to regulatory measures and window guidance to influence credit quantity and channel direction. These may include credit controls or support to specific sectors, loan quotas, and easing or tightening of access to loans, the bond market, or shadow credit. As a result, the best indicator to gauge the monetary stance is through monitoring credit growth and credit impulse (see Chart 7). With liquidity easing starting in mid-2018, market interest rates dropped and credit growth along with credit impulse bottomed in late 2018. Both then rebounded sharply in 2020. In the same vein, while market rates have increased since April 2020, credit growth has continued to accelerate. Indeed, with China’s growth gradually normalizing, the PBOC’s focus seems to be shifting to containing a potential asset bubble and financial risks, demonstrated by its effort to rein in the leverage of the property market. We expect credit growth and credit impulse to peak in October or November of this year.
RELATIVE VALUE OF CHINA’S GOVERNMENT BONDS
As a result of the unique monetary policy intervention through a combination of tools, it is hard to build a valuation model to calibrate the fair value of China’s government bonds. However, we can use the following metrics to assess their relative value to both developed and emerging market bonds (see Chart 8).
From a cross-market government bond valuation perspective, it really depends whether you prefer to compare China with developed markets or emerging markets (EM). For EM, there is a pattern where investors demand higher real yields for countries with higher twin deficits, e.g., Indonesia, Brazil, and South Africa. In this metric, China’s real yield at slightly above zero is not particularly high (see Chart 8). However, if the comparable market is developed market bonds, then China is very attractive since virtually all these government bonds offer negative real yields today. Indeed, over the past three to four years, the significant portion of foreign inflows into Chinese government bonds are from reserve allocations into yuan-denominated assets from sovereign wealth funds and central banks.
CONCLUSION
The PBOC utilizes multiple tools to control monetary policy. In addition to pricing control, quantitative and regulatory or administrative measures are important parts of its tool kit. To gauge the PBOC’s monetary stance for China’s real economy, we should focus more on credit growth and credit impulse rather than just looking at market rates. So far, the PBOC has been tolerating the divergence of market rates and benchmark rates. We do not expect the PBOC to inject liquidity to contain the rate rise as economic activities continue to recover. In addition, we believe caution around a potential asset price bubble and financial risk will restrain the PBOC from easing. Market rates should be range-bound or rise slightly until the end of 2020 as growth further picks up. However, rates should stabilize at a reasonably low level in 2021 given China’s high debt level and slower structural growth.
We believe the current selloff in China’s onshore sovereign bond market has limited further room to run, given its already higher rate differentials relative to the rate markets of developed market countries. Chinese bonds look cheaper than developed market bonds while offering stability and better fundamentals compared to other EM bonds.
DEFINITIONS
A V-shaped recovery is characterized by a quick and sustained recovery in measures of economic performance after a sharp economic decline. Because of the speed of economic adjustment and recovery in macroeconomic performance, a V-shaped recovery is a best case scenario given the recession.
The People’s Bank of China (PBC or PBOC) is the central bank of the People’s Republic of China with the power to control monetary policy and regulate financial institutions in mainland China.
Gross Domestic Product (“GDP”) is an economic statistic which measures the market value of all final goods and services produced within a country in a given period of time.
A safe haven is an investment that is expected to retain or increase in value during times of market turbulence. Safe havens are sought by investors to limit their exposure to losses in the event of market downturns.
Shadow banking refers to financial intermediaries involved in facilitating the creation of credit across the global financial system, but whose members are not subject to regulatory oversight.
Funding liquidity is the availability of credit to finance the purchase of financial assets.
Quantitative easing (QE) refers to a monetary policy implemented by a central bank in which it increases the excess reserves of the banking system through the direct purchase of debt securities.
Zero lower bound is the lower limit that rates can be cut to, but no further. When this level is reached, and the economy is still underperforming, then the central bank can no longer provide stimulus via interest rates.
COVID-19 is the World Health Organization’s official designation of the current novel coronavirus disease. The virus causing the novel coronavirus disease is known as SARS¬CoV-2.
Quantitative tightening (QT) refers to a monetary policy implemented by a central bank in which it reduces the excess reserves of the banking system through the direct sale of debt securities from its own inventory.
The Shanghai Interbank Offered Rate (or Shibor, is a daily reference rate based on the interest rates at which banks offer to lend unsecured funds to other banks in the Shanghai wholesale (or “interbank”) money market.
A corporate bond is a bond issued by a corporation in order to raise financing for a variety of reasons such as to ongoing operations, M&A, or to expand business.
Treasury bonds are government debt securities to finance government spending as an alternative to taxation.
The notion of Credit Impulse has been introduced for the first time by Michael Biggs in November 2008. It represents the flow of new credit issued from the private sector as a percentage of GDP. It is considered as the second derivative of credit growth and arguably the biggest driver behind economic growth.
The medium-term lending facility (MLF) and standing lending facility (SLF) are monetary policy tools established by the PBOC to offer collateralized loans to banks. SLF loans have a shorter maturity and differs from the MLF, which the PBOC uses to manage longer-term liquidity in the banking system.
Repo is a form of short-term borrowing for dealers in government securities.
LPR (Loan Prime Rate) is the most preferential lending rate offered by a commercial bank to its prime clients, and other lending rates can be offered by adding or subtracting basis points based on it.
The reserve requirement ratio (RRR) is the percentage of depositors’ balances banks must have on hand as cash.
Developed markets refers to countries that have sound, well-established economies and are therefore thought to offer safer, more stable investment opportunities than developing markets.
Emerging markets (EM) are nations with social or business activity in the process of rapid growth and industrialization. These nations are sometimes also referred to as developing or less developed countries.
Sovereign wealth funds are pools of money derived from a country’s reserves, which are set aside for investment purposes for the benefit of the country’s economy and citizens.
The International Monetary Fund (IMF) is an international organization of various member countries, established to promote international monetary cooperation, exchange stability, and orderly exchange arrangements.
The twin deficit, or double deficit, occurs when a nation has both a current account deficit and a budget deficit. This means the country’s economy is importing more than it is exporting, and the country’s government is spending more money than it is generating.
WHAT ARE THE RISKS?
Past performance is no guarantee of future results. Please note that an investor cannot invest directly in an index. Unmanaged index returns do not reflect any fees, expenses or sales charges.
Equity securities are subject to price fluctuation and possible loss of principal. Fixed-income securities involve interest rate, credit, inflation and reinvestment risks; and possible loss of principal. As interest rates rise, the value of fixed income securities falls. International investments are subject to special risks including currency fluctuations, social, economic and political uncertainties, which could increase volatility. These risks are magnified in emerging markets. Commodities and currencies contain heightened risk that include market, political, regulatory, and natural conditions and may not be suitable for all investors.
U.S. Treasuries are direct debt obligations issued and backed by the “full faith and credit” of the U.S. government. The U.S. government guarantees the principal and interest payments on U.S. Treasuries when the securities are held to maturity. Unlike U.S. Treasuries, debt securities issued by the federal agencies and instrumentalities and related investments may or may not be backed by the full faith and credit of the U.S. government. Even when the U.S. government guarantees principal and interest payments on securities, this guarantee does not apply to losses resulting from declines in the market value of these securities.
IMPORTANT LEGAL INFORMATION
This material is intended to be of general interest only and should not be construed as individual investment advice or a recommendation or solicitation to buy, sell or hold any security or to adopt any investment strategy. It does not constitute legal or tax advice.
The views expressed are those of the investment manager and the comments, opinions and analyses are rendered as at publication date and may change without notice. The information provided in this material is not intended as a complete analysis of every material fact regarding any country, region or market. All investments involve risks, including possible loss of principal.
Data from third party sources may have been used in the preparation of this material and Franklin Templeton (“FT”) has not independently verified, validated or audited such data. FT accepts no liability whatsoever for any loss arising from use of this information and reliance upon the comments opinions and analyses in the material is at the sole discretion of the user.
Products, services and information may not be available in all jurisdictions and are offered outside the U.S. by other FT affiliates and/or their distributors as local laws and regulation permits. Please consult your own financial professional or Franklin Templeton institutional contact for further information on availability of products and services in your jurisdiction.
Issued in the U.S. by Franklin Templeton Distributors, Inc., One Franklin Parkway, San Mateo, California 94403-1906, (800) DIAL BEN/342-5236, franklintempleton.com – Franklin Templeton Distributors, Inc. is the principal distributor of Franklin Templeton U.S. registered products, which are not FDIC insured; may lose value; and are not bank guaranteed and are available only in jurisdictions where an offer or solicitation of such products is permitted under applicable laws and regulation.
You need Adobe Acrobat Reader to view and print PDF documents. Download a free version from Adobe’s website.
Franklin Templeton Distributors, Inc.


