InvestNow Market Wrap-Up: December 2023
Written by Jason Choy, InvestNow Senior Portfolio Manager
Market Dashboard
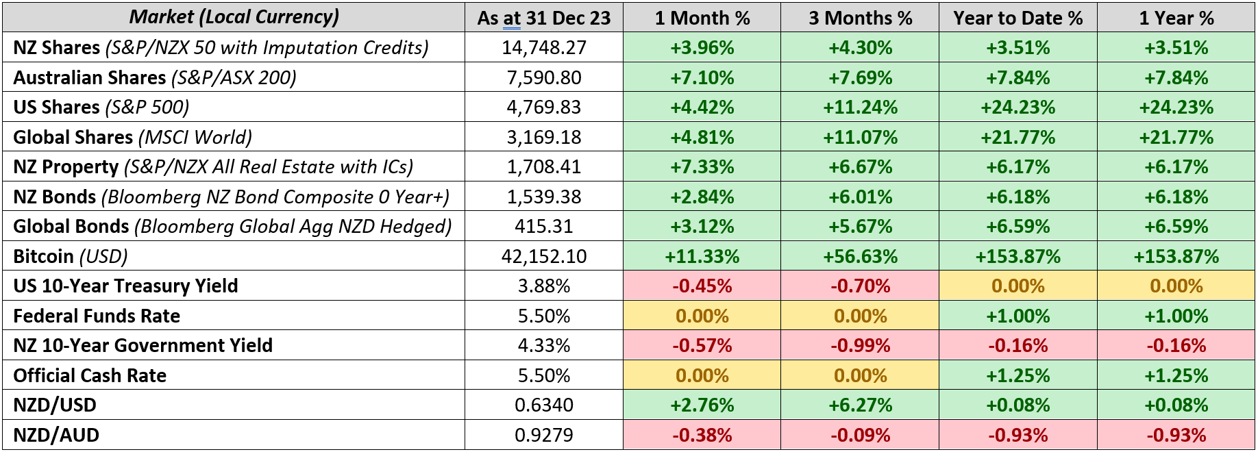
Global share and bond markets close the year off with a crescendo as expectations that central banks have reached the end of their rate hiking cycle ignited a strong market rally. Persistent inflation and geopolitical tensions took a back seat as optimism increased that central banks have in-fact threaded the needle and engineered a soft landing. This saw US and global share indices notch gains of over 20% for the calendar year. Notably, Bitcoin also saw a furious rally, this time fuelled by positive sentiment over the approval of Bitcoin Exchange-Traded Funds, with the cryptocurrency up over 150% in 2023.
Global Markets Summary: December 2023
Global share markets send-off 2023 with a sizable rally – a remarkable two-month surge that first gained traction in November largely wiped away all the negativity and bearish sentiment experienced by markets in the preceding three months. Increasing optimism that interest rate cuts are on central banker’s radars sooner rather than later in 2024 saw the market experience a so-called ‘Santa Claus’ rally, where markets see a significant run-up in the final days of the trading year. The MSCI All Country World Index closed December up +4.0% in New Zealand dollar hedged terms, and up +2.2% in unhedged terms, while finishing up +21.4% and +22.1% respectively over the year – the fourth highest annual return this century.
US stocks led the way over December with the S&P 500 index finishing the month up +4.4% (after an even stronger November result of almost +9%) and a remarkable +24% over the year. The S&P 500 would finish the year just shy of a record high set almost 2 years ago, effectively wiping out all the losses seen in the bear market of 2022. The NASDAQ propelled even further higher, posting a +5.6% gain in December and an astonishing +41.2% over 2023 alone. The remarkable gains were driven by US annual inflation slowing to 3.1%, reinforcing market expectations that the Fed has finished its rate hiking cycle. Indeed, minutes from the Fed’s December meeting showed policymakers expect rates to be cut by 75 bps in 2024.
The year-end rally was notably less concentrated compared to what was seen in much of 2023 – in which just a handful of companies known as the ‘Magnificent Seven’ (Apple, Microsoft, Alphabet, Amazon, Nvidia, Meta and Tesla) accounted for nearly two-thirds of the S&P 500’s 2023 gains. To close out the year however, it was the small-cap and value stocks that outperformed as the Fed’s unexpectedly dovish comments towards the end of the year fuelled a marked shift in investor sentiment. Prior to the Fed’s November meeting, most asset classes were in the negative, while after this meeting, an ‘everything rally’ caught on as expectations of the Fed actually delivering a soft landing (where inflation is kept at bay without adverse impacts on the economy) started gaining traction.
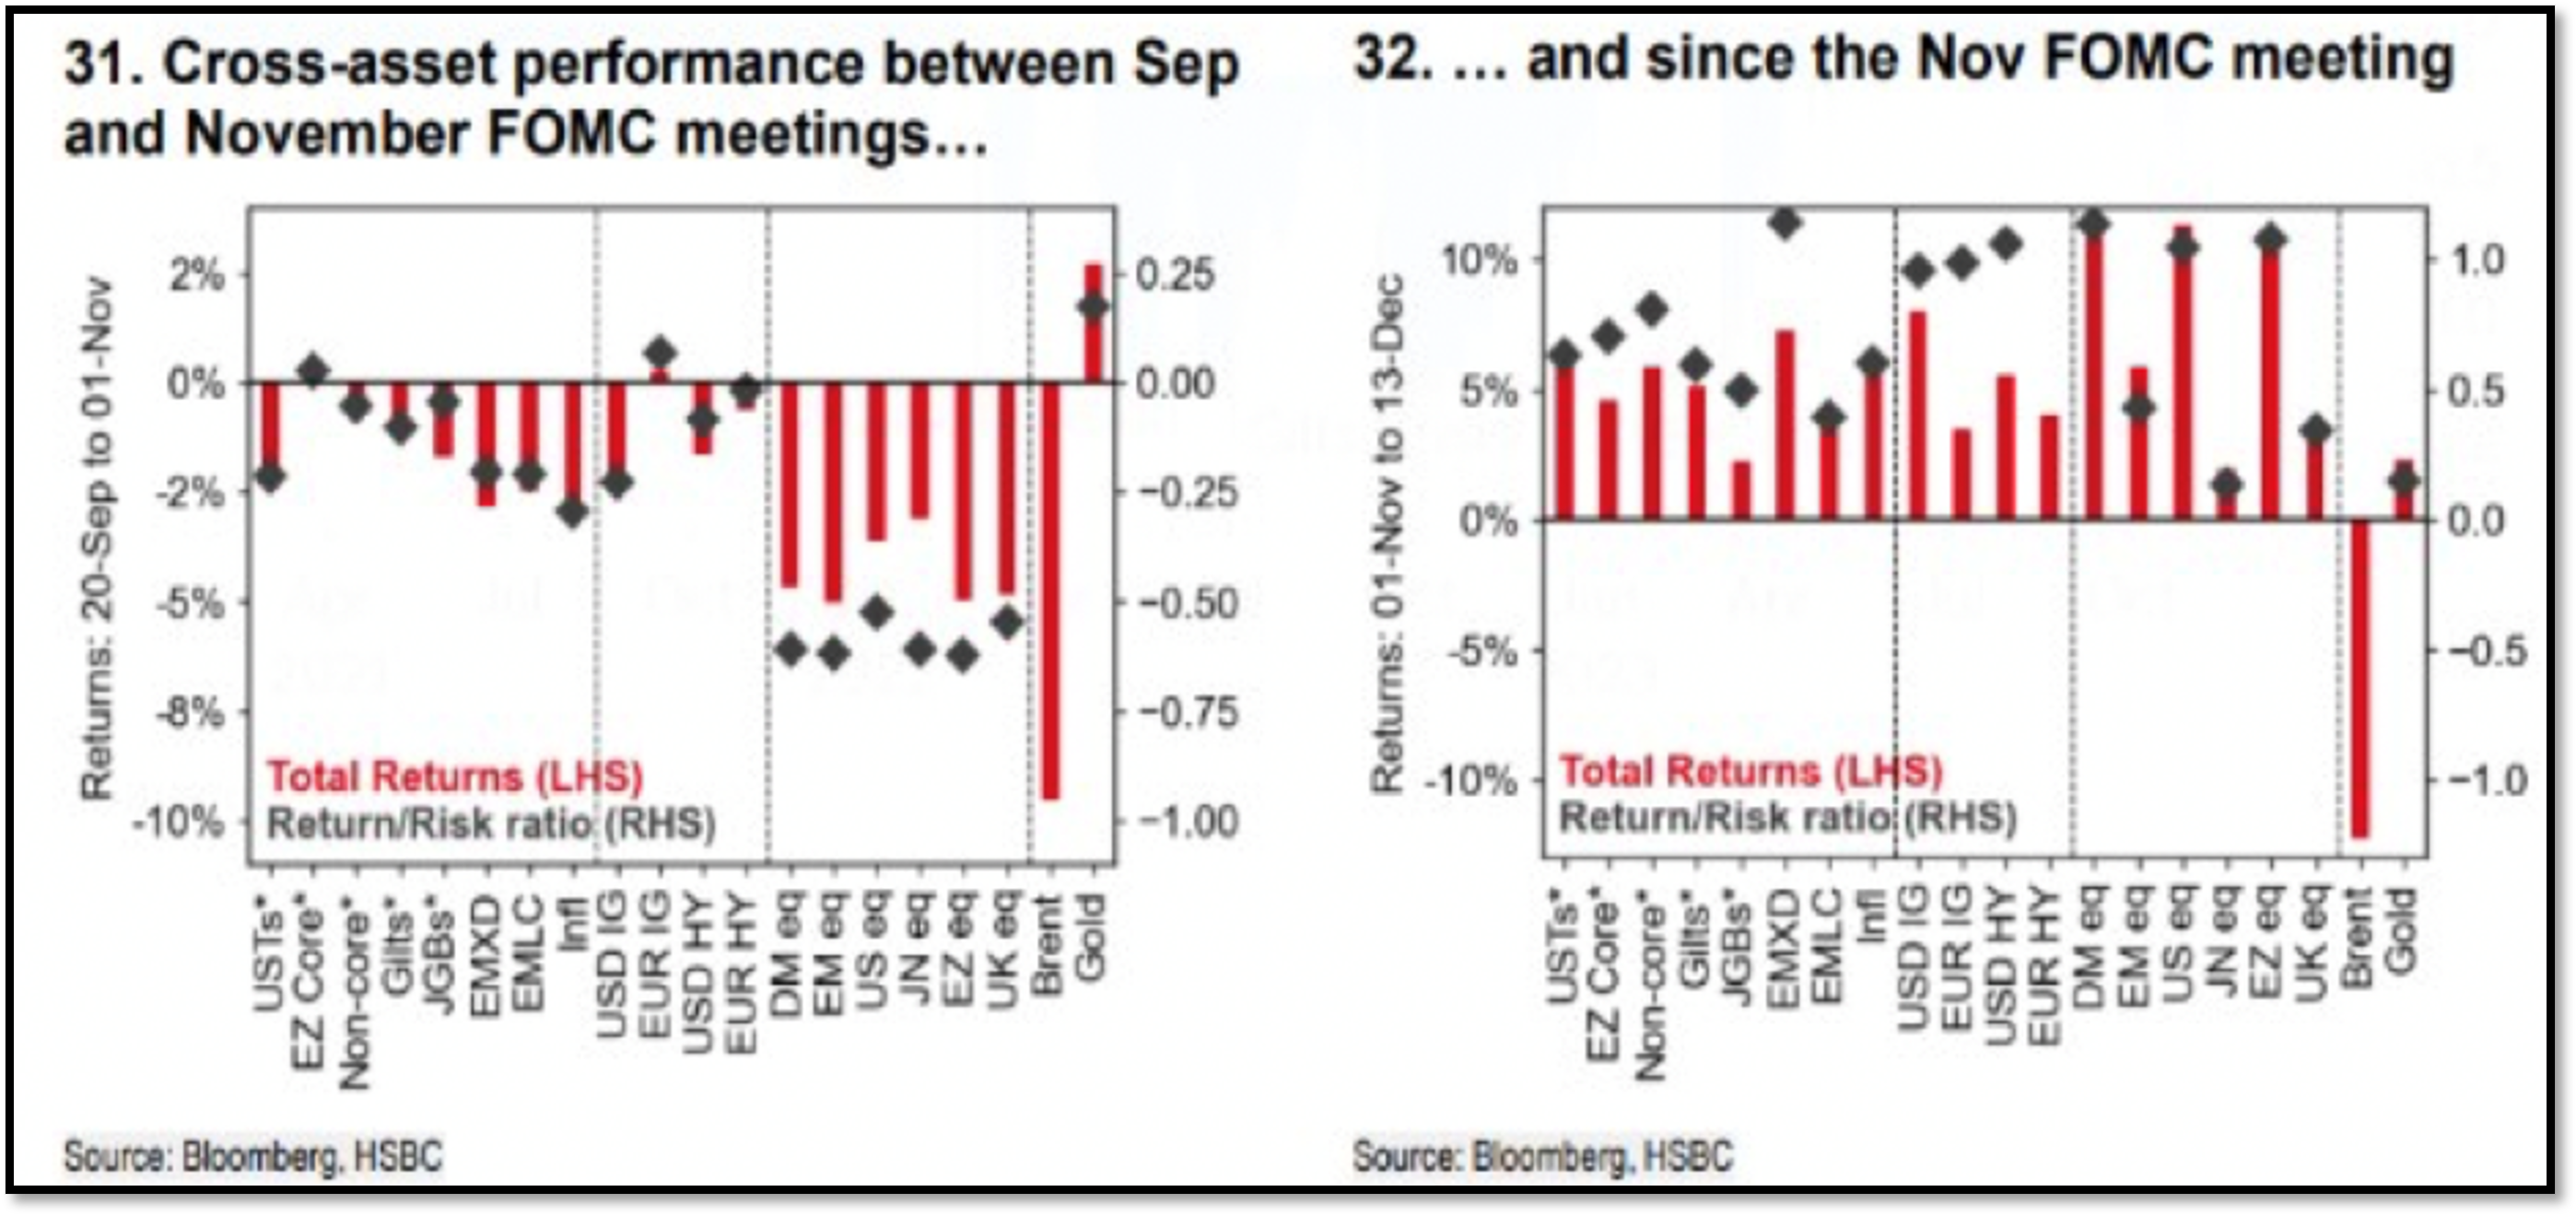
The Federal Reserve’s year-end comments ignited a marked shift in investment sentiment, leading to an ‘Everything Rally’ that took most asset classes from negative to positive territory seemingly overnight.
Wider developed markets also finish higher as monetary policy tightening proves effective. European shares followed their American counterparts higher, finishing the quarter up nearly +8%. Shares were supported by softer inflation figures, which are now down to an annual rate of 2.4% (compared to a year ago where annual Eurozone inflation was over 10%). The higher interest rates have weighed on the Eurozone economy, with GDP down -0.1% over Q3 and market expectation of a contraction (and technical recession) over Q4. Similarly, UK stocks also rose, led by small and mid-cap indices as hopes rise that interest rates have peaked. This followed annual UK inflation clocking in at just 3.9%, while a revision of GDP data also saw the UK economy contracting in Q3.
Asian and Emerging markets broadly close higher, although notable laggards in China. Asian equities saw robust growth over Q4 as hopes that US interest rates have peaked led to renewed investor appetite for risk assets across the region. Despite some weakness in October and December, the Japanese stock market finished the quarter higher off the back of continuous improvement in business sentiment. China was the notable ugly duckling, where shares fell due to the real estate crisis and uncertainty over whether the Chinese government has done enough spur growth following the country’s Covid-induced slowdown. Emerging markets also saw strong returns over the quarter, albeit still behind developed market equities.
Global bond investors see transformative finish to the year as fixed income markets were positive across the board. According to Bloomberg Global Aggregate indices, the final quarter of the year marked the best quarterly performance for global bonds in over two decades. The major driver of this step-change was a perceived shift in central banker’s monetary policy direction from ‘higher for longer’ to prospective interest rate cuts. Government bond yields accordingly fell across the board, with the US 10-Year Treasury falling 45 bps over the month and completing a round trip – where it both started and finished the year at 3.88% despite recently touching highs of 5%. While the Bank of England’s policymakers remain divided on additional tightening, the UK 10-Year yield also saw similar falls, dropping 90 bps over Q4.
Key updates for the Kiwi investor:
New Zealand share market finishes the month higher, but underwhelms for the year. The S&P/NZX 50 Gross Index (with imputation credits) advanced 4.0% over the month, supporting by signs that monetary policy is working effectively – perhaps signalling an earlier than expected end to Reserve Bank of New Zealand’s (RBNZ) interest rate hiking cycle. The local share market notched a solid monthly return despite some earning downgrades over the period to consumer cyclicals (including Air New Zealand, Heartland, Kathmandu and Sky City). Across calendar year 2023 though, the NZ market had little to show for it, up just +3.5% and underperforming our global counterparts, including Australia (+7.8%) and the US (+24%).
Local bonds follow global counterparts to finish positive over the month. This was supported by a significant fall in NZ government bond yields, where only two months earlier, the New Zealand 10-year government bond yield sat at 5.6%, and has come down a whopping 130 bps to 4.3% to round out the year. The hefty drop came as wider falls were seen in other developed markets’ government bonds, but also points to market reactions to a weakening ‘higher for longer’ narrative locally. This saw the Bloomberg NZ Bond Composite 0+ Yr Index return +2.8% in December.
Stress testing the New Zealand economy – when is monetary policy considered too effective? Central banks like the RBNZ combat inflation by raising interest rates in order to dampen economic activity. Tight monetary policy is proving effective in reducing demand within New Zealand, however a prolonged period of elevated interest rates can also be problematic for an economy, particularly when it leads to a ‘hard landing’ – where the country gets pushed into a recession and unemployment rises severely.
New Zealand economy is in worse shape than previously thought due to effective monetary policy. Monetary policy is working better than previously assumed, but the New Zealand economy is in much worse shape than expected with Q3 GDP data showing the economy contracted by -0.3% over the quarter. This means the New Zealand economy is 1.8% smaller than the RBNZ had previously assumed at its most recent November meeting. While absolute GDP numbers may appear robust on the surface, these are inflated by the influx of migrants NZ has seen of late. The GDP numbers on a per capita basis are poor, with GDP down more than 3% over the past year.
The poor economic data would ordinarily signal that the RBNZ’s OCR forecast is set to be lower. The RBNZ had originally signaled the potential for one more rate hike in 2024 in its most recent meeting, but the poor GDP data may be enough evidence for the RBNZ to call it a day in this rate hiking cycle and look toward rate cuts like other central banks. This would be a boon to the local market and relief for many Kiwis tackling the cost of living crisis, with the potential for mortgages rates to lower on the horizon.
However, the caveat is that markets as always are dynamic – rarely are even the best analysts and economists forecasts set in stone – with there being much more data for the RBNZ to sift through before their next monetary policy decision. The all-important NZ inflation and labour market data will be available prior to the RBNZ’s next meeting at the end of February, which could set the tone for how local markets perform in 2024.
Chart of the month:
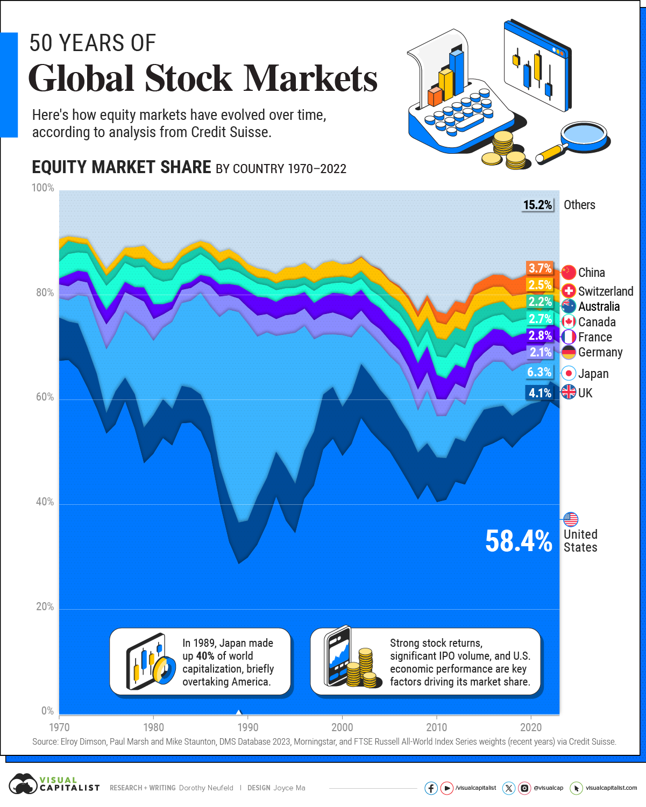
History has shown that a country’s slice of the global equity market can evolve significantly over time – which highlights the benefits of diversifying not just across sectors but also countries.
Our chart of the month is from Visual Capitalist with data from Credit Suisse, which outlines how each country’s share of the total global stock market has evolved over the last 50 years.
The US has traditionally been the dominant financial power in world share markets, constituting close to 60% of current global share indices. All other countries combined don’t even come close to the US’s influence, with the next largest country being Japan, which sits at around a tenth of the US’s share at ~6%. The US’s dominance reflects a number of factors, including the US dollar’s status as a reserve currency, the depth and maturity of its financial markets, alongside its economic and military strength.
Historically though, a country’s share of the global share market can change significantly over time, with any one country’s place at (or near) the top not a given by any means. In 1989 for example, Japan led the world, making up 40% of the world’s market capitalisation following turbo-charged economic growth. The US would fall behind at just 30% or around half of its current global market share. However, Japan would subsequently go on to suffer a severe stock market crash, resulting in over three ‘lost decades’ before the Japanese stock market would recover the losses suffered from this crash. Despite recovering these losses, Japan has not even come close to recapturing the lion’s share of the global share market, highlighting that a country’s day in the sun can be short lived.
This highlights the potential for countries to rise and fall in equity markets – just like how certain industries or sectors can either breakthrough to be the next in-trend investment (such as Artificial Intelligence as of late), or fall out of favour (see the dotcom bubble) – countries can also see significant step-changes in positive or negative directions. China is an obvious example of a country that could drive significant change to the global share market composition. Its current ~4% share of the global share market is far away from its status as the world’s second largest economy, providing scope for significant growth. However, geopolitical risks with China could also limit its impact on global financial markets (see Russia as an example of this risk).
This highlights one of InvestNow’s Investing Principles on the benefits of diversifying – this time amongst countries. Because countries can fall in and out of favour, it can be prudent to diversify your investments across multiple countries. This can allow you to be insulated from any one country suffering a significant shock (due to political or economic reasons) but also provides potential upside to any country that drives significant growth.
What we’ve been reading:
- Antipodes: Focusing on Tomorrow’s Winners
- Devon: What does 2024 have in store?
- Dexus: Infrastructure: The Essential Ingredient?
- Elevation: Asset Class Analysis: Farmland
- Ellerston Capital: 5 stocks with the innovation edge (that are not mega-cap technology)
- Fisher Funds: The Season of Predictions and Promises
- Franklin Templeton: Cash is not always king
- Generate: What to do when financial markets are down
- Milford: Nimble fund management key in 2024
- Mint: The bird in the hand or two in the bush?
- Morningstar: Unlearn what you have learned about investing: Lessons from 2023
- Te Ahumairangi: Noise or trend? Or seasonal effect?
InvestNow Market Wrap-Up: December 2023
Written by Jason Choy, InvestNow Senior Portfolio Manager
Market Dashboard
Global share and bond markets close the year off with a crescendo as expectations that central banks have reached the end of their rate hiking cycle ignited a strong market rally. Persistent inflation and geopolitical tensions took a back seat as optimism increased that central banks have in-fact threaded the needle and engineered a soft landing. This saw US and global share indices notch gains of over 20% for the calendar year. Notably, Bitcoin also saw a furious rally, this time fuelled by positive sentiment over the approval of Bitcoin Exchange-Traded Funds, with the cryptocurrency up over 150% in 2023.
Global Markets Summary: December 2023
Global share markets send-off 2023 with a sizable rally – a remarkable two-month surge that first gained traction in November largely wiped away all the negativity and bearish sentiment experienced by markets in the preceding three months. Increasing optimism that interest rate cuts are on central banker’s radars sooner rather than later in 2024 saw the market experience a so-called ‘Santa Claus’ rally, where markets see a significant run-up in the final days of the trading year. The MSCI All Country World Index closed December up +4.0% in New Zealand dollar hedged terms, and up +2.2% in unhedged terms, while finishing up +21.4% and +22.1% respectively over the year – the fourth highest annual return this century.
US stocks led the way over December with the S&P 500 index finishing the month up +4.4% (after an even stronger November result of almost +9%) and a remarkable +24% over the year. The S&P 500 would finish the year just shy of a record high set almost 2 years ago, effectively wiping out all the losses seen in the bear market of 2022. The NASDAQ propelled even further higher, posting a +5.6% gain in December and an astonishing +41.2% over 2023 alone. The remarkable gains were driven by US annual inflation slowing to 3.1%, reinforcing market expectations that the Fed has finished its rate hiking cycle. Indeed, minutes from the Fed’s December meeting showed policymakers expect rates to be cut by 75 bps in 2024.
The year-end rally was notably less concentrated compared to what was seen in much of 2023 – in which just a handful of companies known as the ‘Magnificent Seven’ (Apple, Microsoft, Alphabet, Amazon, Nvidia, Meta and Tesla) accounted for nearly two-thirds of the S&P 500’s 2023 gains. To close out the year however, it was the small-cap and value stocks that outperformed as the Fed’s unexpectedly dovish comments towards the end of the year fuelled a marked shift in investor sentiment. Prior to the Fed’s November meeting, most asset classes were in the negative, while after this meeting, an ‘everything rally’ caught on as expectations of the Fed actually delivering a soft landing (where inflation is kept at bay without adverse impacts on the economy) started gaining traction.
The Federal Reserve’s year-end comments ignited a marked shift in investment sentiment, leading to an ‘Everything Rally’ that took most asset classes from negative to positive territory seemingly overnight.
Wider developed markets also finish higher as monetary policy tightening proves effective. European shares followed their American counterparts higher, finishing the quarter up nearly +8%. Shares were supported by softer inflation figures, which are now down to an annual rate of 2.4% (compared to a year ago where annual Eurozone inflation was over 10%). The higher interest rates have weighed on the Eurozone economy, with GDP down -0.1% over Q3 and market expectation of a contraction (and technical recession) over Q4. Similarly, UK stocks also rose, led by small and mid-cap indices as hopes rise that interest rates have peaked. This followed annual UK inflation clocking in at just 3.9%, while a revision of GDP data also saw the UK economy contracting in Q3.
Asian and Emerging markets broadly close higher, although notable laggards in China. Asian equities saw robust growth over Q4 as hopes that US interest rates have peaked led to renewed investor appetite for risk assets across the region. Despite some weakness in October and December, the Japanese stock market finished the quarter higher off the back of continuous improvement in business sentiment. China was the notable ugly duckling, where shares fell due to the real estate crisis and uncertainty over whether the Chinese government has done enough spur growth following the country’s Covid-induced slowdown. Emerging markets also saw strong returns over the quarter, albeit still behind developed market equities.
Global bond investors see transformative finish to the year as fixed income markets were positive across the board. According to Bloomberg Global Aggregate indices, the final quarter of the year marked the best quarterly performance for global bonds in over two decades. The major driver of this step-change was a perceived shift in central banker’s monetary policy direction from ‘higher for longer’ to prospective interest rate cuts. Government bond yields accordingly fell across the board, with the US 10-Year Treasury falling 45 bps over the month and completing a round trip – where it both started and finished the year at 3.88% despite recently touching highs of 5%. While the Bank of England’s policymakers remain divided on additional tightening, the UK 10-Year yield also saw similar falls, dropping 90 bps over Q4.
Key updates for the Kiwi investor:
New Zealand share market finishes the month higher, but underwhelms for the year. The S&P/NZX 50 Gross Index (with imputation credits) advanced 4.0% over the month, supporting by signs that monetary policy is working effectively – perhaps signalling an earlier than expected end to Reserve Bank of New Zealand’s (RBNZ) interest rate hiking cycle. The local share market notched a solid monthly return despite some earning downgrades over the period to consumer cyclicals (including Air New Zealand, Heartland, Kathmandu and Sky City). Across calendar year 2023 though, the NZ market had little to show for it, up just +3.5% and underperforming our global counterparts, including Australia (+7.8%) and the US (+24%).
Local bonds follow global counterparts to finish positive over the month. This was supported by a significant fall in NZ government bond yields, where only two months earlier, the New Zealand 10-year government bond yield sat at 5.6%, and has come down a whopping 130 bps to 4.3% to round out the year. The hefty drop came as wider falls were seen in other developed markets’ government bonds, but also points to market reactions to a weakening ‘higher for longer’ narrative locally. This saw the Bloomberg NZ Bond Composite 0+ Yr Index return +2.8% in December.
Stress testing the New Zealand economy – when is monetary policy considered too effective? Central banks like the RBNZ combat inflation by raising interest rates in order to dampen economic activity. Tight monetary policy is proving effective in reducing demand within New Zealand, however a prolonged period of elevated interest rates can also be problematic for an economy, particularly when it leads to a ‘hard landing’ – where the country gets pushed into a recession and unemployment rises severely.
New Zealand economy is in worse shape than previously thought due to effective monetary policy. Monetary policy is working better than previously assumed, but the New Zealand economy is in much worse shape than expected with Q3 GDP data showing the economy contracted by -0.3% over the quarter. This means the New Zealand economy is 1.8% smaller than the RBNZ had previously assumed at its most recent November meeting. While absolute GDP numbers may appear robust on the surface, these are inflated by the influx of migrants NZ has seen of late. The GDP numbers on a per capita basis are poor, with GDP down more than 3% over the past year.
The poor economic data would ordinarily signal that the RBNZ’s OCR forecast is set to be lower. The RBNZ had originally signaled the potential for one more rate hike in 2024 in its most recent meeting, but the poor GDP data may be enough evidence for the RBNZ to call it a day in this rate hiking cycle and look toward rate cuts like other central banks. This would be a boon to the local market and relief for many Kiwis tackling the cost of living crisis, with the potential for mortgages rates to lower on the horizon.
However, the caveat is that markets as always are dynamic – rarely are even the best analysts and economists forecasts set in stone – with there being much more data for the RBNZ to sift through before their next monetary policy decision. The all-important NZ inflation and labour market data will be available prior to the RBNZ’s next meeting at the end of February, which could set the tone for how local markets perform in 2024.
Chart of the month:
History has shown that a country’s slice of the global equity market can evolve significantly over time – which highlights the benefits of diversifying not just across sectors but also countries.
Our chart of the month is from Visual Capitalist with data from Credit Suisse, which outlines how each country’s share of the total global stock market has evolved over the last 50 years.
The US has traditionally been the dominant financial power in world share markets, constituting close to 60% of current global share indices. All other countries combined don’t even come close to the US’s influence, with the next largest country being Japan, which sits at around a tenth of the US’s share at ~6%. The US’s dominance reflects a number of factors, including the US dollar’s status as a reserve currency, the depth and maturity of its financial markets, alongside its economic and military strength.
Historically though, a country’s share of the global share market can change significantly over time, with any one country’s place at (or near) the top not a given by any means. In 1989 for example, Japan led the world, making up 40% of the world’s market capitalisation following turbo-charged economic growth. The US would fall behind at just 30% or around half of its current global market share. However, Japan would subsequently go on to suffer a severe stock market crash, resulting in over three ‘lost decades’ before the Japanese stock market would recover the losses suffered from this crash. Despite recovering these losses, Japan has not even come close to recapturing the lion’s share of the global share market, highlighting that a country’s day in the sun can be short lived.
This highlights the potential for countries to rise and fall in equity markets – just like how certain industries or sectors can either breakthrough to be the next in-trend investment (such as Artificial Intelligence as of late), or fall out of favour (see the dotcom bubble) – countries can also see significant step-changes in positive or negative directions. China is an obvious example of a country that could drive significant change to the global share market composition. Its current ~4% share of the global share market is far away from its status as the world’s second largest economy, providing scope for significant growth. However, geopolitical risks with China could also limit its impact on global financial markets (see Russia as an example of this risk).
This highlights one of InvestNow’s Investing Principles on the benefits of diversifying – this time amongst countries. Because countries can fall in and out of favour, it can be prudent to diversify your investments across multiple countries. This can allow you to be insulated from any one country suffering a significant shock (due to political or economic reasons) but also provides potential upside to any country that drives significant growth.
What we’ve been reading:
- Antipodes: Focusing on Tomorrow’s Winners
- Devon: What does 2024 have in store?
- Dexus: Infrastructure: The Essential Ingredient?
- Elevation: Asset Class Analysis: Farmland
- Ellerston Capital: 5 stocks with the innovation edge (that are not mega-cap technology)
- Fisher Funds: The Season of Predictions and Promises
- Franklin Templeton: Cash is not always king
- Generate: What to do when financial markets are down
- Milford: Nimble fund management key in 2024
- Mint: The bird in the hand or two in the bush?
- Morningstar: Unlearn what you have learned about investing: Lessons from 2023
- Te Ahumairangi: Noise or trend? Or seasonal effect?