InvestNow Market Wrap-Up: February 2024
Written by Jason Choy, InvestNow Senior Portfolio Manager
Market Dashboard
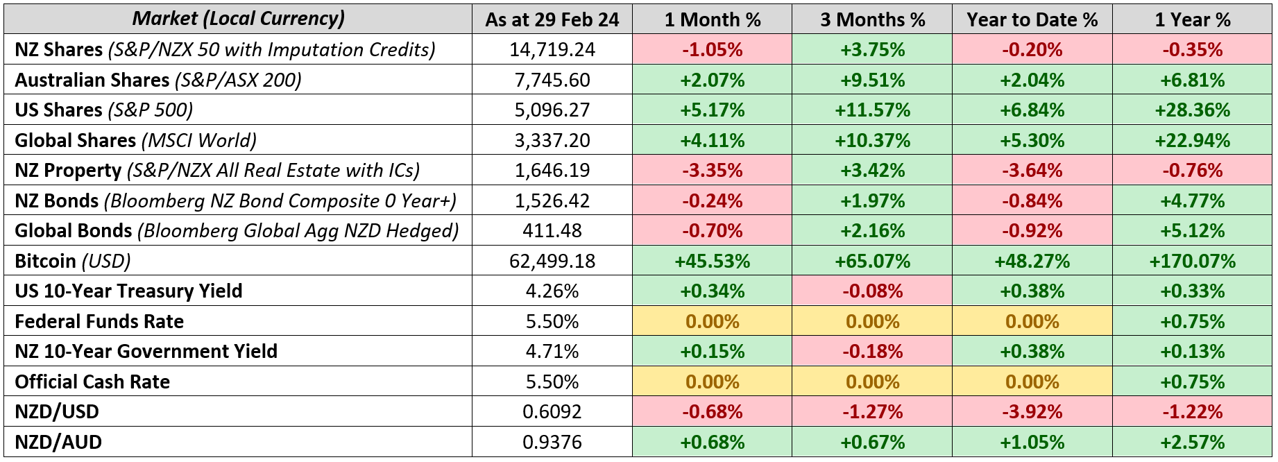
Share market indices rose to record levels across the globe while bonds continue to struggle as resilient economic data, alongside signs of lingering inflationary pressures, suggests central banks will likely be holding interest rates steady for a little while longer. Another notable asset was Bitcoin, which after a slow start to the year took off, returning nearly 50% in February alone and nearing all-time highs last set in November 2021. This was driven by the recently approved bitcoin ETFs seeing billions in weekly inflows, including from retail investors as well as emerging markets like Nigeria which have troubled currencies.
Global Markets Summary: February 2024
Global share markets saw a record-breaking month in February, fuelled by data supporting the notion that global economies will be able to stick the soft landing as well as a relatively strong earnings season. Growth stocks continued to lead the way, driven by the usual suspects such as mega-cap tech stocks. Emerging markets outperformed developed markets over the month primarily thanks to a rebound in China. The MSCI All Country World Index (ACWI) would continue its positive run, finishing the month +5.4% in unhedged New Zealand dollar terms, while returning +4.7% in hedged terms as the USD continued to weaken relative to the Kiwi dollar.
US stocks continue rolling in 2024 as the S&P 500 reaches the 5,000 milestone, returning +5.2% over the month and having risen in 16 of the last 18 months to the end of February – something not seen in over 50 years. The market’s exponential gains are highlighted by the increasingly shorter time periods between each 1,000 level milestone, with the first 1,000 taking 41 years for the S&P 500 to achieve in 1998, while the 2,000 level was hit 16 years later in 2014, followed by 3,000 just 5 years after that in 2019 and 4,000 coming less than 2 years later in 2021. While the 2022 bear market threw a spanner in the works, since late 2023 the S&P 500 has been on a tear, rising over 20% since the start of November and adding $9 trillion USD in market cap over the period – more than the entire value of China’s stock market.
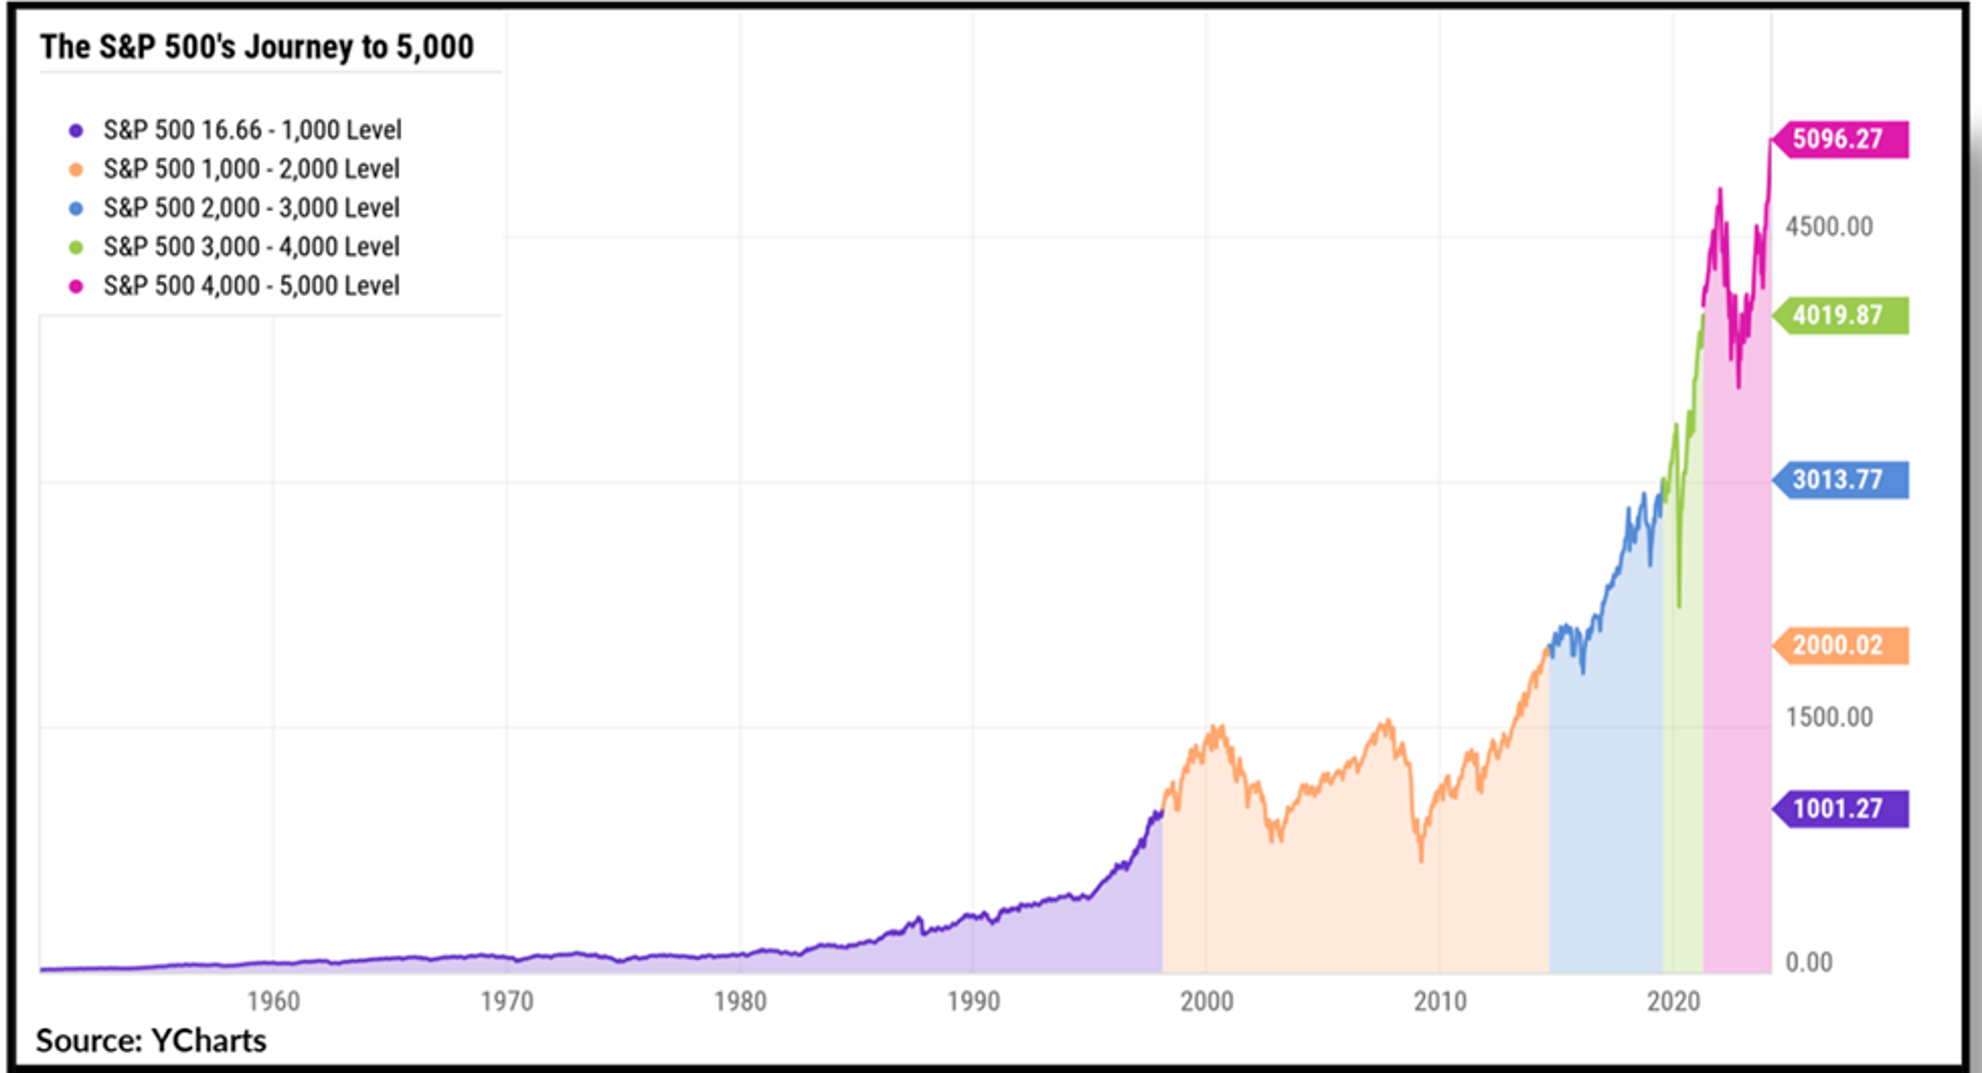
The S&P 500 crossed the 5,000 level in February, taking less than a year to move from the previous 4,000 threshold. Contrast this with the 41 years it took to hit the first 1,000 and 16 years to hit the 2,000 mark.
The gains were driven by stronger than expected economic growth in the US, with 353,000 jobs added in January as well as inflation slowing down to 3.1%, which saw expectations for interest rate cuts pushed out. While such ‘good news’ on the economic front was considered ‘bad news’ last year and added to market volatility (given the uncertainty of how long interest rates would remain elevated), ‘good news’ is once again ‘good news’ as markets have been taking the positive economic data in stride as optimism increases that it is a matter of if, not when interest rates will be cut in 2024.
Strong corporate earnings also bolstered the US share market, with over three-quarters of S&P 500 companies having beaten analysts’ earnings forecasts and earnings growth hitting nearly 8% in Q4. The focus again was on members of the ‘Magnificent Seven’, which reported a 59% profit surge over the quarter. Excluding these firms, the rest of the index posted a -2% decline in profits. While some have raised concerns about the dominance of a handful of stocks on the entire market, it is worth noting that this most recent rally has seen gains from a broader group of names and a bit more fragmentation from the ‘Magnificent Seven’ members – for example, while NVIDIA is up 60% in the first two months of 2024, Tesla is down around -20% over the same period.
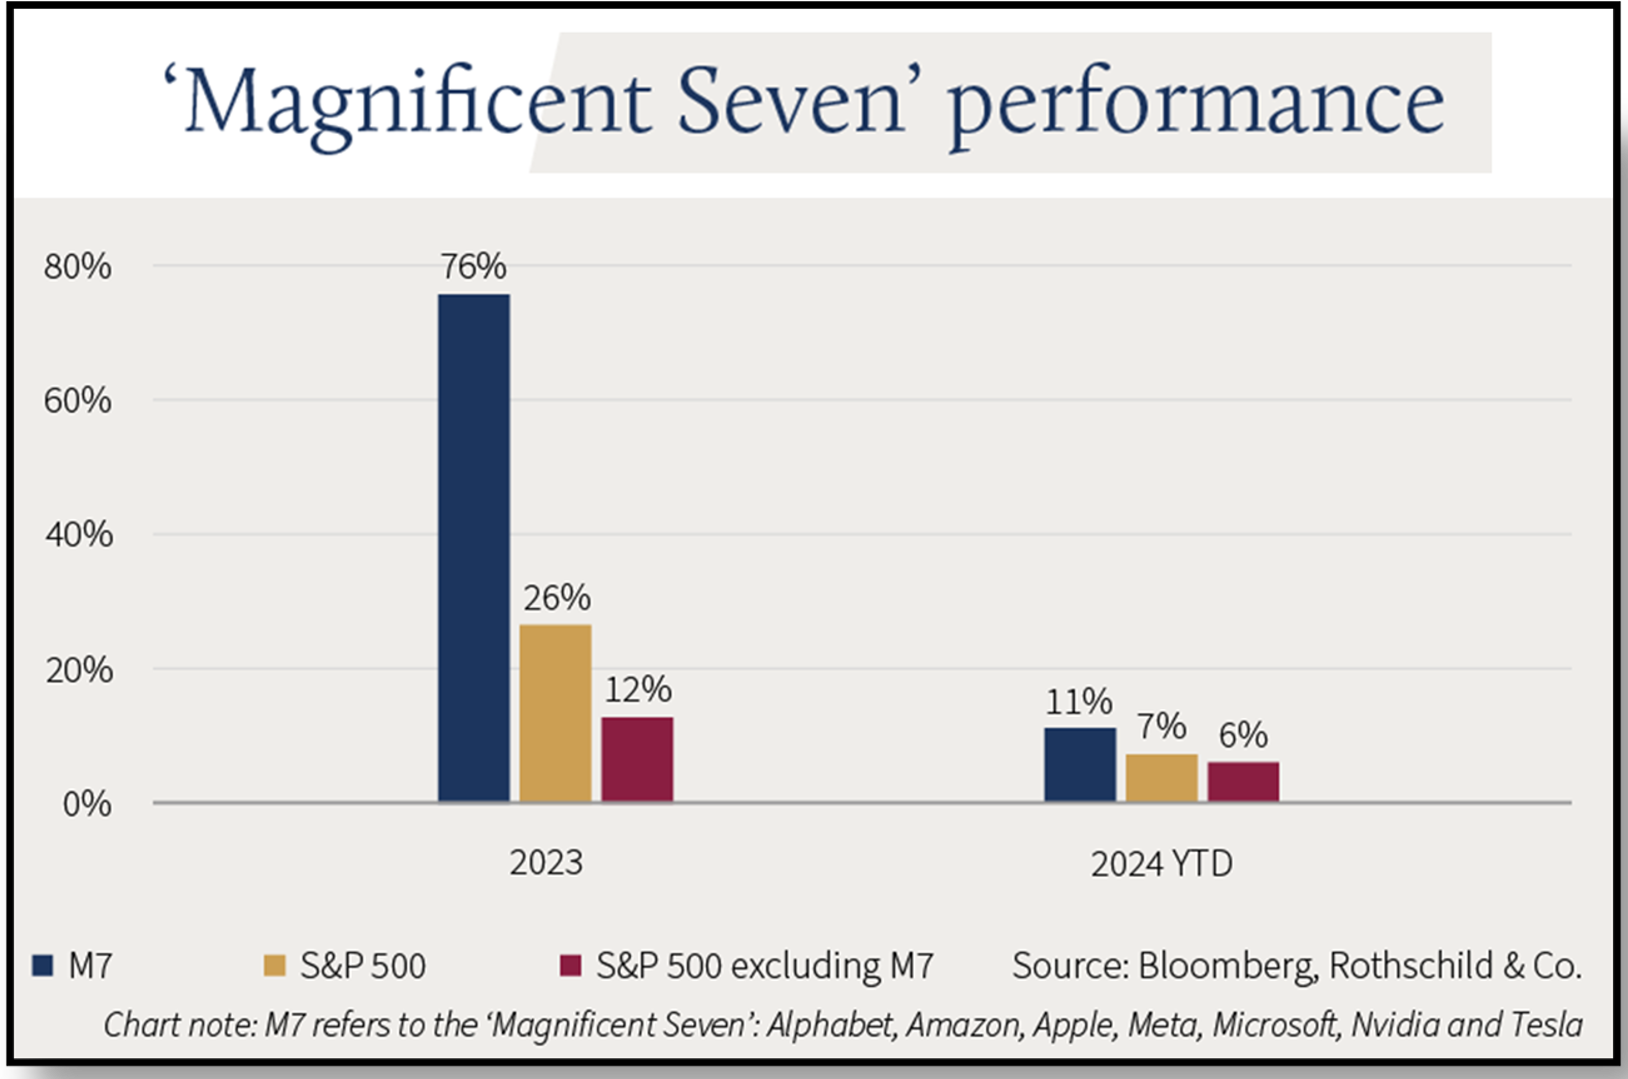
Market concentration fears following the dominance of the ‘Magnificent Seven’ in 2023 have been somewhat allayed, given the recent market rally has been fuelled by gains from a broader group of names.
Markets were less fruitful for European and UK stocks as central banks continued to downplay rate cuts. Although the MSCI Europe ex-UK index still rose +2.8% in February, it underperformed relative to the developed market MSCI World Index (+4.3%). Despite Eurozone inflation easing to 2.6% and a larger than expected rise in business activity, European Central Bank President Lagarde remained cautious around any notions of imminent rate cuts. UK stocks also underperformed and are now down -1.1% over 2024 following news the UK entered a technical recession last year, while UK inflation remained steady at 4%.
Japanese stocks finally notch new record high after 34 years. Despite a weaker than expected Q4 GDP figure that put Japan in a technical recession, the Japanese share market has been the best performing stock market of 2024, up +20% following a +4.9% rise in February en route to notching a new all-time high. This was the first record high since 1989, or the bubble era, just before the asset crash that kicked off decades of inflation. Demand for Japanese stocks from global investors has been strong, with supporters including the likes of Warren Buffett, driven by corporate governance reforms, a cheap yen and strong profits on offer.
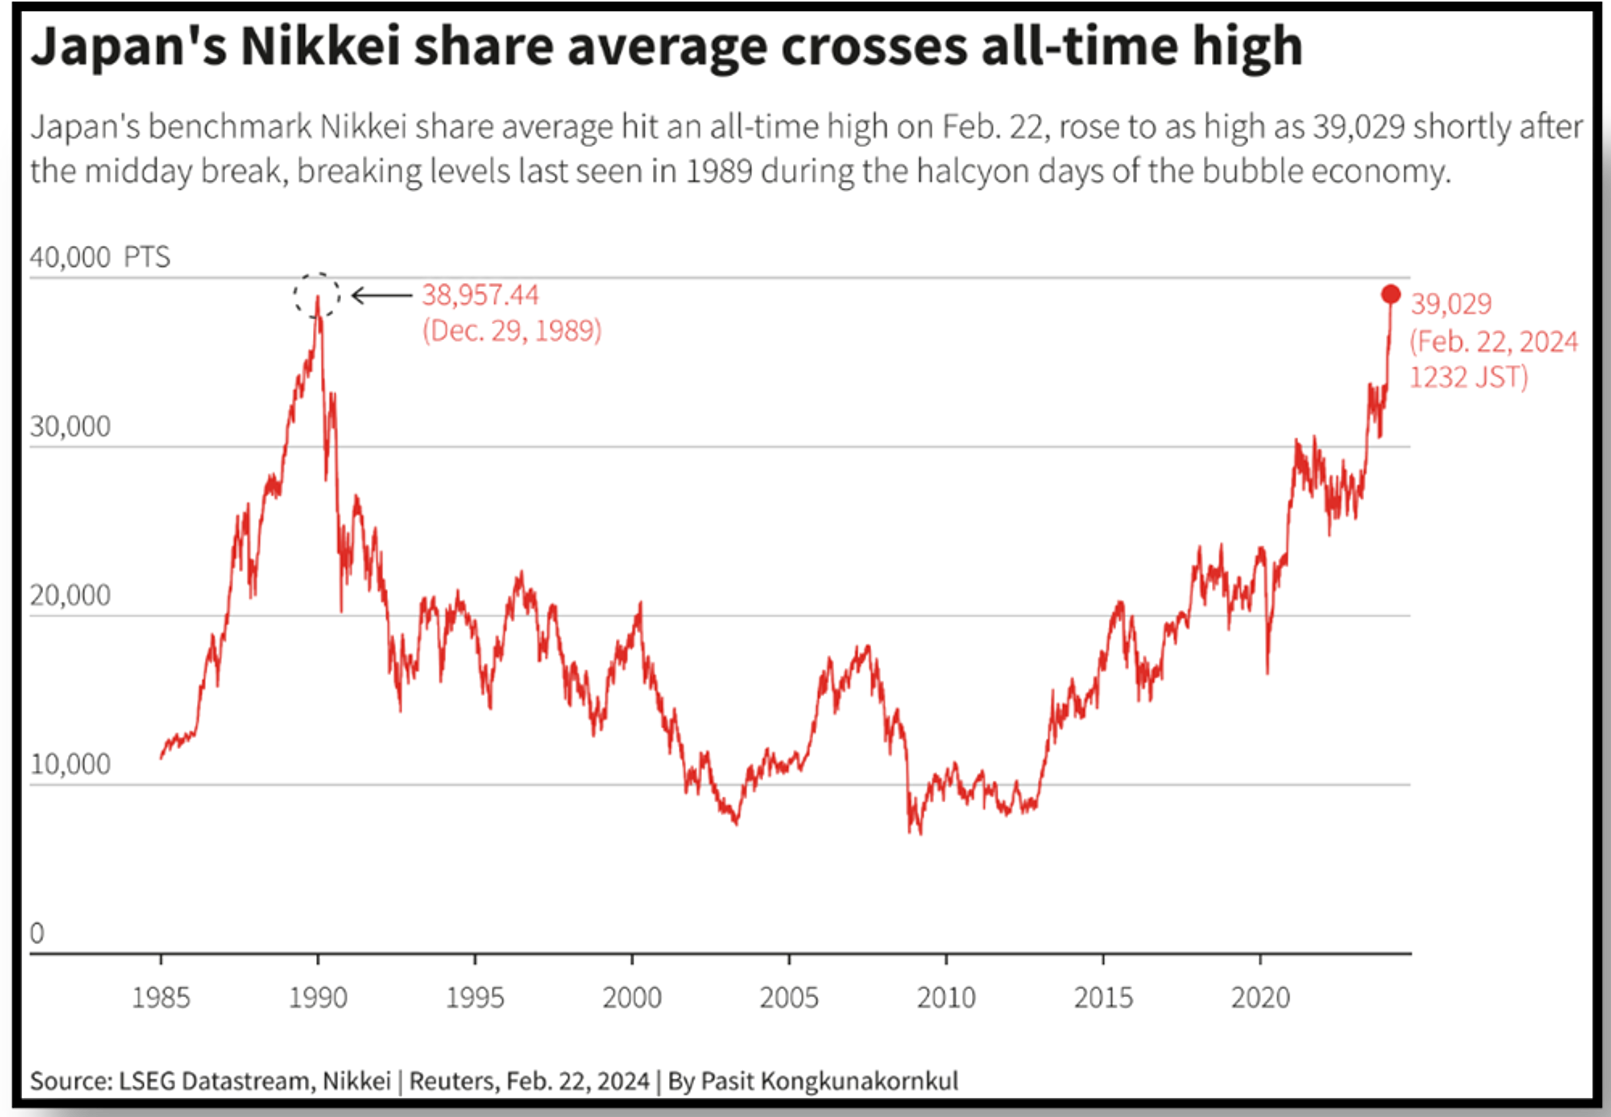
Following the 1989 bubble burst and decades of deflation, the Japanese stock market has returned to all-time highs after 34 years, driven by offshore investor demand fuelled by strong profits and a cheap yen.
Wider Asian and Emerging markets also finished strong, fuelled by a dramatic rebound in China. While Chinese equity markets had hit five year-lows heading into February, strong tourism activity over the Lunar New Year (with revenues higher than in the period before the Covid-19 crisis) alongside the Chinese government’s announcement of several supportive interventions (including a cut to the 5-year prime loan rate) saw the MSCI China Index gain +8.6% over February. This also drove strong performance in wider Asian and Emerging indices, with all markets in the MSCI AC Asia index ending the month in positive territory, led by China, South Korea and Taiwan and the demand for semiconductor and AI-related stocks.
Global bonds see another month in the red as markets adjust expectations for interest rate cuts. Uncertainty around the US inflation outlook led the market to dial back some of its enthusiasm for imminent rate cuts. This followed the core measure of inflation registering its largest increase since April 2023, which saw US 10-year Treasury yields rising 29 bps to 4.24%. UK bonds were particularly weak, with UK 10-year yields rising 32 bps to 4.12% as wage growth in the UK fell less than expected in December (total earnings increased 5.8% year-on-year), which pushed investors to pare back forecasts of rate cuts from the Bank of England. Although Eurozone inflation news was comparatively more encouraging, European central bankers continue to underscore the risks of premature rate cuts. Overall, this saw the Bloomberg Global Aggregate Index hedged to the NZD return -0.70% for the month.
Key updates for the Kiwi investor:
New Zealand’s share market saw a challenging month, finishing February in the red, with the S&P/NZX 50 Gross Index (with imputation credits) returning -1.1% over the month. February is known as a reporting month for listed companies on the New Zealand Stock Exchange (NZX), who share their earnings results over the most recent quarter. The local share market was dragged down by a weaker-than-expected earnings report season, with more profit against expectations misses than beats, alongside more post-result consensus earnings forecast reductions than increases for NZX constituents.
Local bond indices finished mildly lower for the second straight month. The Bloomberg NZBond Composite 0+ Yr Index fell -0.2% over the month with NZ 10-year government bond yields seeing a modest increase of 15 bps over the month to finish at 4.7%. February proved to be a nervy month for the domestic bond market as investors digested calls from the economists of New Zealand’s largest bank for 2024 to open up with two more rate hikes from the Reserve Bank of New Zealand (RBNZ).
The RBNZ’s first meeting of 2024 proved to be more balanced, with the OCR remaining steady at 5.5%. At the meeting, the central bank did not discuss a cut, although a hike was up for debate. There was also a welcome acknowledgement from the RBNZ that inflation has cooled more than expected but RBNZ’s Governor, Adrian Orr still highlighted there is limited ability to tolerate upside surprises to inflation.
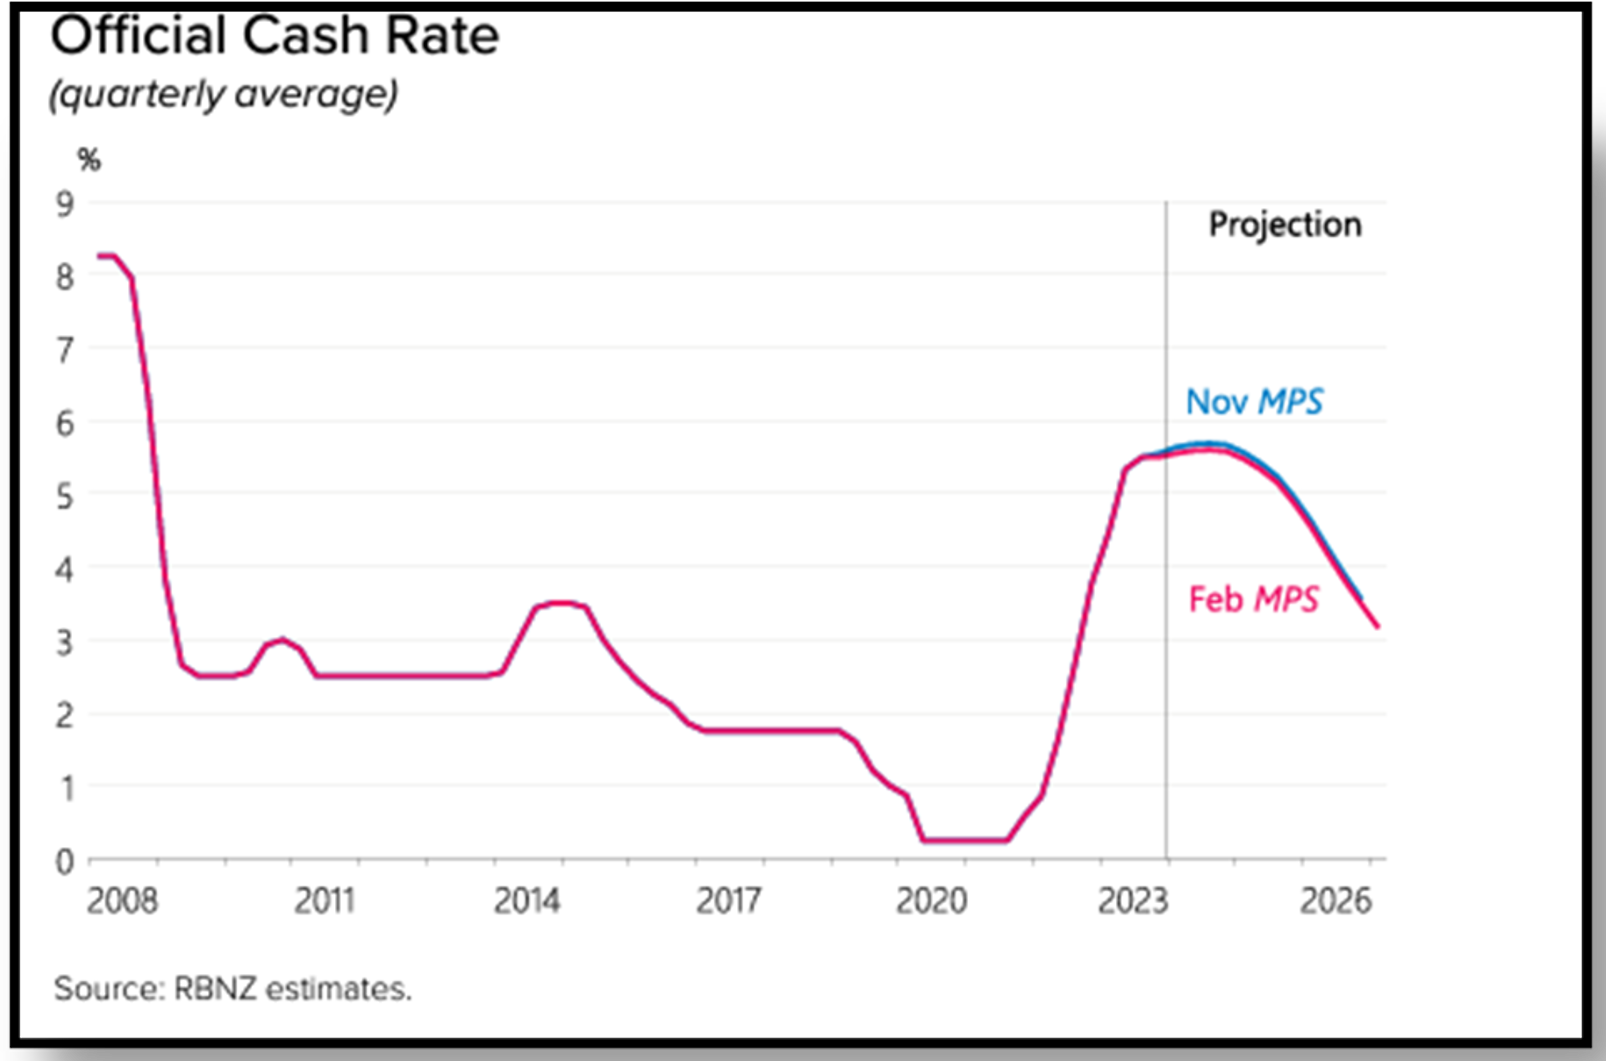
The RBNZ kept the OCR steady at 5.5% in their first meeting of the year, although did slightly bring forward their expectations of when first rate cuts might occur, which at this stage is still not until 2025.
Notwithstanding this, the central bank did make a few key adjustments to its interest rate outlook. This included lowering its forecast of the interest rate path by 10 bps to now peak at just 5.6%, as well as implying rate cuts to start slightly earlier, from the second half to now the first half of 2025. The tone of the RBNZ was notably less hawkish than the comments made in the previous November meeting, although still a far cry from the more dovish outlook that many local investment managers have outlined. This includes Harbour and Devon, who anticipate the first rate cuts to occur in the second half of this year, citing the delayed impact of tight monetary policy, which is still making its way through the economy. A common view is that by later this year, when many Kiwis will have refinanced their mortgages at increasingly higher rates, it will be clear that an OCR that is 3% above the RBNZ’s target will no longer be necessary.
Chart of the month:
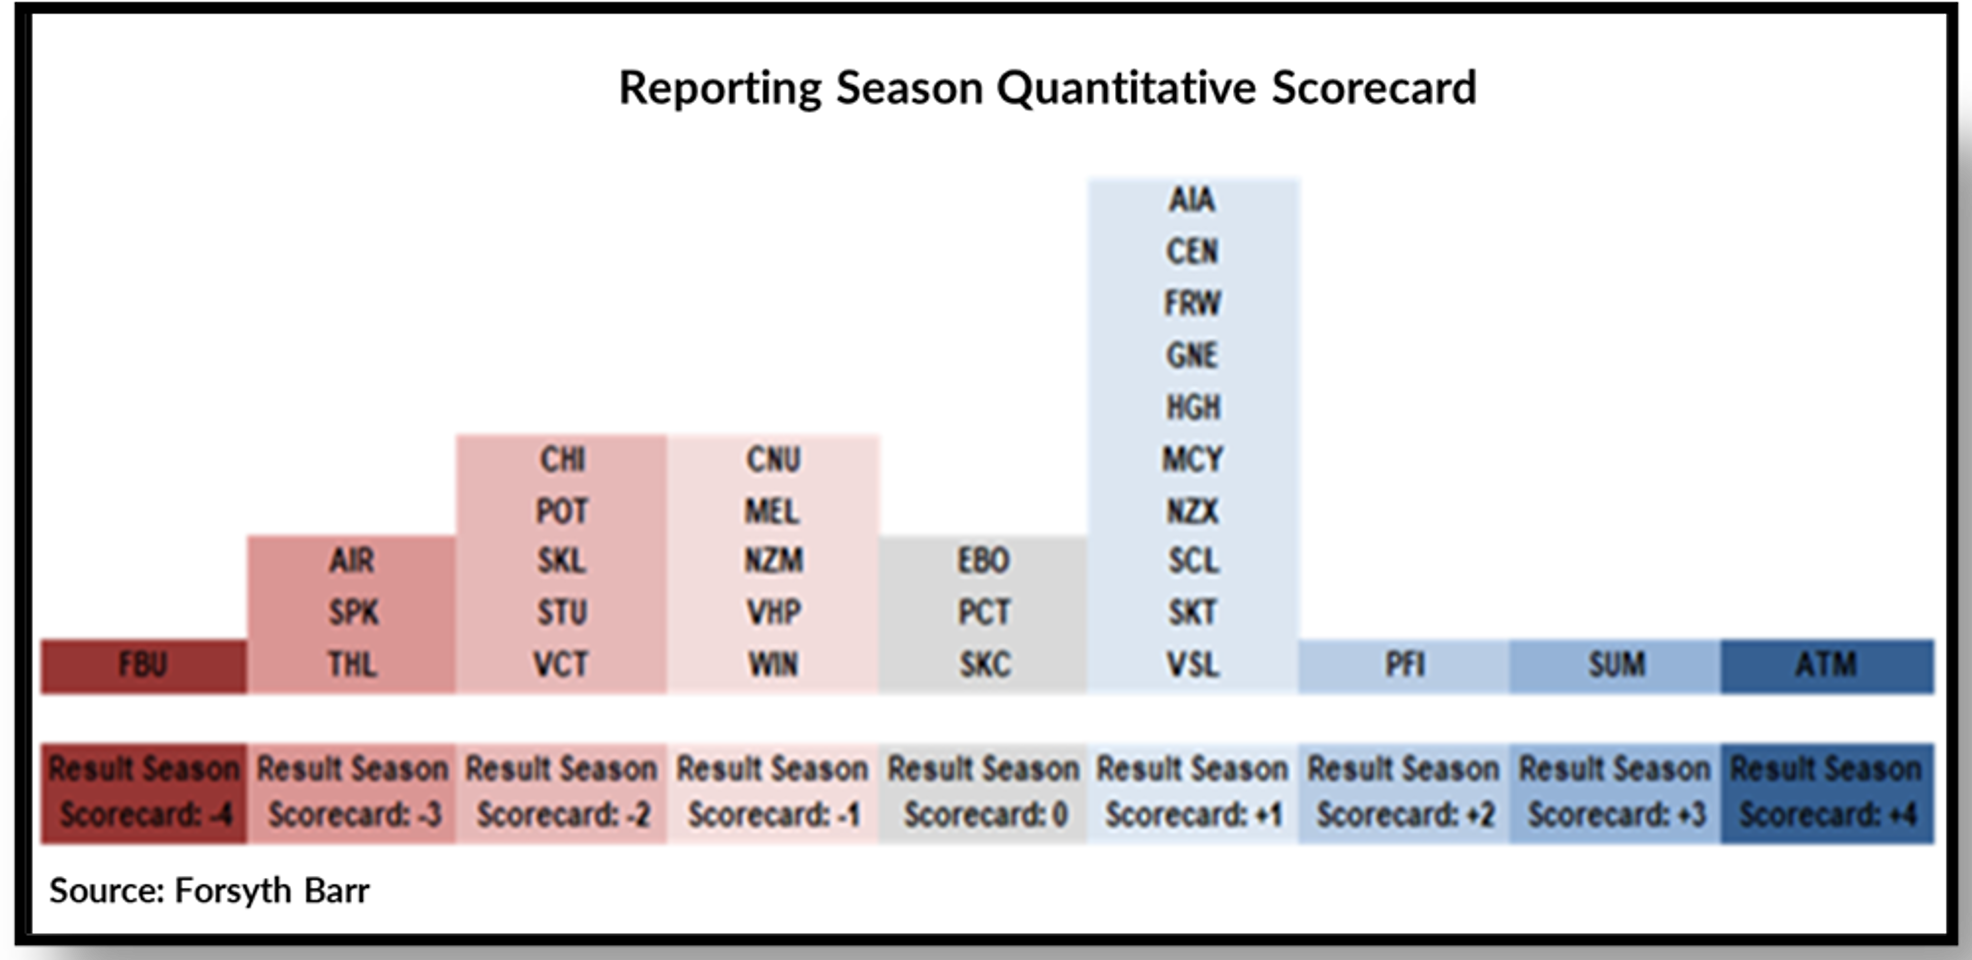
Forsyth Barr’s Reporting Season Scorecard noted that many NZX 50 companies had a challenging quarter.
Our Chart of the Month is a Reporting Season Quantitative Scorecard from Forsyth Barr, which ranks how NZ listed companies have performed this earnings reporting season. Each NZX listed company is represented by their stock ticker (e.g. AIA = Auckland International Airport) and provided a positive, negative or neutral score based on a weighting of a few key factors, including:
- Whether the company’s earnings figures beat or missed market expectations
- Any revisions to the company’s forward-looking earnings projections
- The stock market’s reaction to the earnings results on the day of reporting; and
- The overall outlook for the company going forward.
Looking at the scorecard, you can see the clear winners and losers have been reflected in the stock price. The runaway winner from this reporting season was A2 Milk (ATM), which saw earnings rise 5% off the back of a growing market presence in the all-important Chinese market, where they’ve been positioning themselves as a premium product. It is no coincidence then that A2 Milk is up 33% in the first two months of the year alone. On the other end of the spectrum, Fletcher Building (FBU) delivered a poor earnings result with earnings dropping 27%, driven by a weakening NZ residential construction sector where volumes have declined 20%, which saw Fletcher Building stock down -12% to start the year.
A company’s earnings are a key metric that investment managers follow to determine the stock’s value. This reflects the traditional view of a company’s valuation being the discounted sum of its future cash flows. Cash flows predominantly consist of the earnings (profits) that the company generates as part of its business activities, which is why the market has an eagle-eyed view on the earnings that a company reports, as well as any comments made from management that may inform the profitability of the company going forward.
As investors, it is important to understand the drivers of a company’s stock market performance, which over the long-term are intrinsically tied to their business results. Although there can be short-term mispricing in securities that some traders aim to take advantage of, many pundits have also gotten burned attempting to do so. Instead, long-term investors should view investing as owning a slice of a company, and therefore the goal is to invest in companies or sectors that have strong growth prospects and that will generate robust earnings, which is a tried-and-true way of achieving success in the investing game.
Bonus Chart from Harbour illustrates this long-term relationship between earnings and share prices, which highlights that the performance of the stock market (in this case the S&P 500) is closely tied to the constituent companies’ aggregated forward-looking earnings per share (EPS). In other words, the stock market closely tracks the overall profitability of each company within the index, as measured by analysts’ forecasts of companies’ earnings in 12 months.
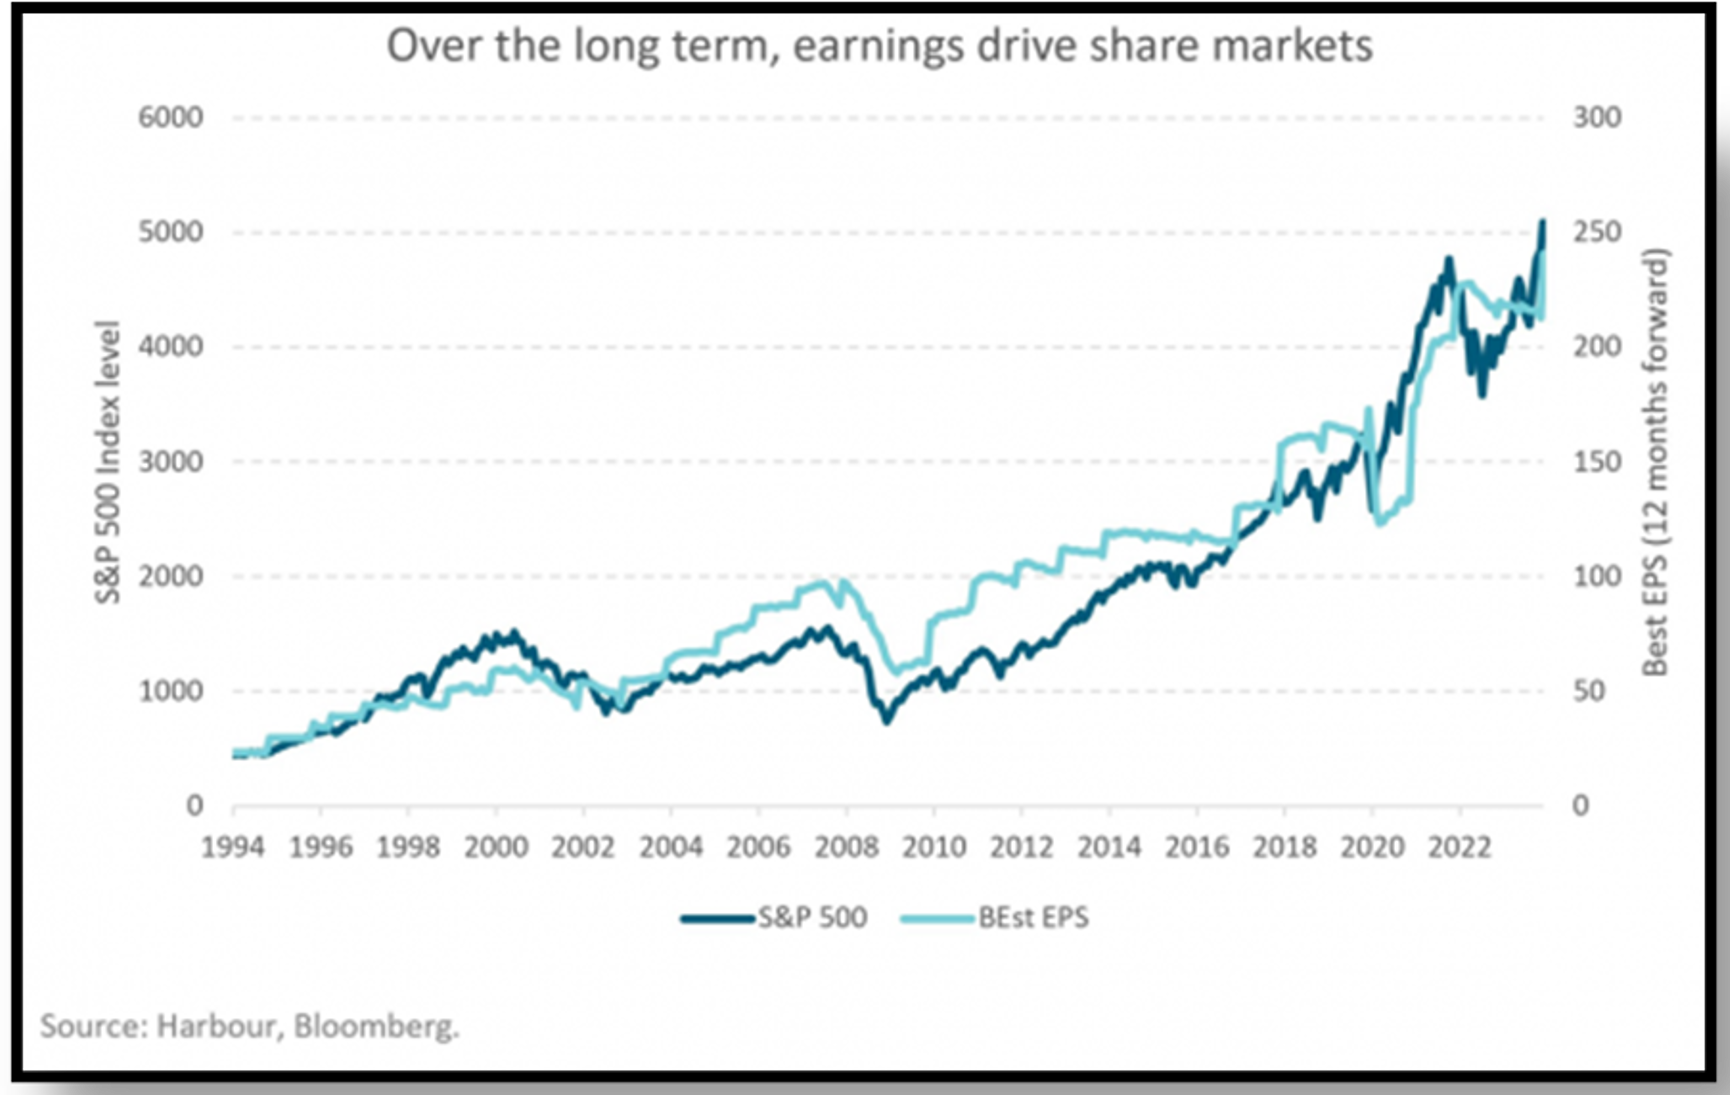
Over the long term, the best indicator of stock market performance is the company’s earnings growth.
What we’ve been reading:
- Antipodes: Tomorrow’s winners; five mispriced opportunities
- Castle Point: Recent Studies show that Passive Investing now Outweighs Active Investing
- Franklin Templeton: A Vote for Value Stocks in 2024
- Investment News: S&P Data Shows Average NZ Active Manager Outperforms
- Markets with Madison: How the Bitcoin Halving Could Boost its Price Further
- Milford: Bonds. Corporate Bonds
- Mint: Macro Outlook 2024
- Octagon: Signal to Noise: What’s Material When Investing
- Salt: You Gotta Know When to Hold ‘em
InvestNow Market Wrap-Up: February 2024
Written by Jason Choy, InvestNow Senior Portfolio Manager
Market Dashboard
Share market indices rose to record levels across the globe while bonds continue to struggle as resilient economic data, alongside signs of lingering inflationary pressures, suggests central banks will likely be holding interest rates steady for a little while longer. Another notable asset was Bitcoin, which after a slow start to the year took off, returning nearly 50% in February alone and nearing all-time highs last set in November 2021. This was driven by the recently approved bitcoin ETFs seeing billions in weekly inflows, including from retail investors as well as emerging markets like Nigeria which have troubled currencies.
Global Markets Summary: February 2024
Global share markets saw a record-breaking month in February, fuelled by data supporting the notion that global economies will be able to stick the soft landing as well as a relatively strong earnings season. Growth stocks continued to lead the way, driven by the usual suspects such as mega-cap tech stocks. Emerging markets outperformed developed markets over the month primarily thanks to a rebound in China. The MSCI All Country World Index (ACWI) would continue its positive run, finishing the month +5.4% in unhedged New Zealand dollar terms, while returning +4.7% in hedged terms as the USD continued to weaken relative to the Kiwi dollar.
US stocks continue rolling in 2024 as the S&P 500 reaches the 5,000 milestone, returning +5.2% over the month and having risen in 16 of the last 18 months to the end of February – something not seen in over 50 years. The market’s exponential gains are highlighted by the increasingly shorter time periods between each 1,000 level milestone, with the first 1,000 taking 41 years for the S&P 500 to achieve in 1998, while the 2,000 level was hit 16 years later in 2014, followed by 3,000 just 5 years after that in 2019 and 4,000 coming less than 2 years later in 2021. While the 2022 bear market threw a spanner in the works, since late 2023 the S&P 500 has been on a tear, rising over 20% since the start of November and adding $9 trillion USD in market cap over the period – more than the entire value of China’s stock market.
The S&P 500 crossed the 5,000 level in February, taking less than a year to move from the previous 4,000 threshold. Contrast this with the 41 years it took to hit the first 1,000 and 16 years to hit the 2,000 mark.
The gains were driven by stronger than expected economic growth in the US, with 353,000 jobs added in January as well as inflation slowing down to 3.1%, which saw expectations for interest rate cuts pushed out. While such ‘good news’ on the economic front was considered ‘bad news’ last year and added to market volatility (given the uncertainty of how long interest rates would remain elevated), ‘good news’ is once again ‘good news’ as markets have been taking the positive economic data in stride as optimism increases that it is a matter of if, not when interest rates will be cut in 2024.
Strong corporate earnings also bolstered the US share market, with over three-quarters of S&P 500 companies having beaten analysts’ earnings forecasts and earnings growth hitting nearly 8% in Q4. The focus again was on members of the ‘Magnificent Seven’, which reported a 59% profit surge over the quarter. Excluding these firms, the rest of the index posted a -2% decline in profits. While some have raised concerns about the dominance of a handful of stocks on the entire market, it is worth noting that this most recent rally has seen gains from a broader group of names and a bit more fragmentation from the ‘Magnificent Seven’ members – for example, while NVIDIA is up 60% in the first two months of 2024, Tesla is down around -20% over the same period.
Market concentration fears following the dominance of the ‘Magnificent Seven’ in 2023 have been somewhat allayed, given the recent market rally has been fuelled by gains from a broader group of names.
Markets were less fruitful for European and UK stocks as central banks continued to downplay rate cuts. Although the MSCI Europe ex-UK index still rose +2.8% in February, it underperformed relative to the developed market MSCI World Index (+4.3%). Despite Eurozone inflation easing to 2.6% and a larger than expected rise in business activity, European Central Bank President Lagarde remained cautious around any notions of imminent rate cuts. UK stocks also underperformed and are now down -1.1% over 2024 following news the UK entered a technical recession last year, while UK inflation remained steady at 4%.
Japanese stocks finally notch new record high after 34 years. Despite a weaker than expected Q4 GDP figure that put Japan in a technical recession, the Japanese share market has been the best performing stock market of 2024, up +20% following a +4.9% rise in February en route to notching a new all-time high. This was the first record high since 1989, or the bubble era, just before the asset crash that kicked off decades of inflation. Demand for Japanese stocks from global investors has been strong, with supporters including the likes of Warren Buffett, driven by corporate governance reforms, a cheap yen and strong profits on offer.
Following the 1989 bubble burst and decades of deflation, the Japanese stock market has returned to all-time highs after 34 years, driven by offshore investor demand fuelled by strong profits and a cheap yen.
Wider Asian and Emerging markets also finished strong, fuelled by a dramatic rebound in China. While Chinese equity markets had hit five year-lows heading into February, strong tourism activity over the Lunar New Year (with revenues higher than in the period before the Covid-19 crisis) alongside the Chinese government’s announcement of several supportive interventions (including a cut to the 5-year prime loan rate) saw the MSCI China Index gain +8.6% over February. This also drove strong performance in wider Asian and Emerging indices, with all markets in the MSCI AC Asia index ending the month in positive territory, led by China, South Korea and Taiwan and the demand for semiconductor and AI-related stocks.
Global bonds see another month in the red as markets adjust expectations for interest rate cuts. Uncertainty around the US inflation outlook led the market to dial back some of its enthusiasm for imminent rate cuts. This followed the core measure of inflation registering its largest increase since April 2023, which saw US 10-year Treasury yields rising 29 bps to 4.24%. UK bonds were particularly weak, with UK 10-year yields rising 32 bps to 4.12% as wage growth in the UK fell less than expected in December (total earnings increased 5.8% year-on-year), which pushed investors to pare back forecasts of rate cuts from the Bank of England. Although Eurozone inflation news was comparatively more encouraging, European central bankers continue to underscore the risks of premature rate cuts. Overall, this saw the Bloomberg Global Aggregate Index hedged to the NZD return -0.70% for the month.
Key updates for the Kiwi investor:
New Zealand’s share market saw a challenging month, finishing February in the red, with the S&P/NZX 50 Gross Index (with imputation credits) returning -1.1% over the month. February is known as a reporting month for listed companies on the New Zealand Stock Exchange (NZX), who share their earnings results over the most recent quarter. The local share market was dragged down by a weaker-than-expected earnings report season, with more profit against expectations misses than beats, alongside more post-result consensus earnings forecast reductions than increases for NZX constituents.
Local bond indices finished mildly lower for the second straight month. The Bloomberg NZBond Composite 0+ Yr Index fell -0.2% over the month with NZ 10-year government bond yields seeing a modest increase of 15 bps over the month to finish at 4.7%. February proved to be a nervy month for the domestic bond market as investors digested calls from the economists of New Zealand’s largest bank for 2024 to open up with two more rate hikes from the Reserve Bank of New Zealand (RBNZ).
The RBNZ’s first meeting of 2024 proved to be more balanced, with the OCR remaining steady at 5.5%. At the meeting, the central bank did not discuss a cut, although a hike was up for debate. There was also a welcome acknowledgement from the RBNZ that inflation has cooled more than expected but RBNZ’s Governor, Adrian Orr still highlighted there is limited ability to tolerate upside surprises to inflation.
The RBNZ kept the OCR steady at 5.5% in their first meeting of the year, although did slightly bring forward their expectations of when first rate cuts might occur, which at this stage is still not until 2025.
Notwithstanding this, the central bank did make a few key adjustments to its interest rate outlook. This included lowering its forecast of the interest rate path by 10 bps to now peak at just 5.6%, as well as implying rate cuts to start slightly earlier, from the second half to now the first half of 2025. The tone of the RBNZ was notably less hawkish than the comments made in the previous November meeting, although still a far cry from the more dovish outlook that many local investment managers have outlined. This includes Harbour and Devon, who anticipate the first rate cuts to occur in the second half of this year, citing the delayed impact of tight monetary policy, which is still making its way through the economy. A common view is that by later this year, when many Kiwis will have refinanced their mortgages at increasingly higher rates, it will be clear that an OCR that is 3% above the RBNZ’s target will no longer be necessary.
Chart of the month:
Forsyth Barr’s Reporting Season Scorecard noted that many NZX 50 companies had a challenging quarter.
Our Chart of the Month is a Reporting Season Quantitative Scorecard from Forsyth Barr, which ranks how NZ listed companies have performed this earnings reporting season. Each NZX listed company is represented by their stock ticker (e.g. AIA = Auckland International Airport) and provided a positive, negative or neutral score based on a weighting of a few key factors, including:
- Whether the company’s earnings figures beat or missed market expectations
- Any revisions to the company’s forward-looking earnings projections
- The stock market’s reaction to the earnings results on the day of reporting; and
- The overall outlook for the company going forward.
Looking at the scorecard, you can see the clear winners and losers have been reflected in the stock price. The runaway winner from this reporting season was A2 Milk (ATM), which saw earnings rise 5% off the back of a growing market presence in the all-important Chinese market, where they’ve been positioning themselves as a premium product. It is no coincidence then that A2 Milk is up 33% in the first two months of the year alone. On the other end of the spectrum, Fletcher Building (FBU) delivered a poor earnings result with earnings dropping 27%, driven by a weakening NZ residential construction sector where volumes have declined 20%, which saw Fletcher Building stock down -12% to start the year.
A company’s earnings are a key metric that investment managers follow to determine the stock’s value. This reflects the traditional view of a company’s valuation being the discounted sum of its future cash flows. Cash flows predominantly consist of the earnings (profits) that the company generates as part of its business activities, which is why the market has an eagle-eyed view on the earnings that a company reports, as well as any comments made from management that may inform the profitability of the company going forward.
As investors, it is important to understand the drivers of a company’s stock market performance, which over the long-term are intrinsically tied to their business results. Although there can be short-term mispricing in securities that some traders aim to take advantage of, many pundits have also gotten burned attempting to do so. Instead, long-term investors should view investing as owning a slice of a company, and therefore the goal is to invest in companies or sectors that have strong growth prospects and that will generate robust earnings, which is a tried-and-true way of achieving success in the investing game.
Bonus Chart from Harbour illustrates this long-term relationship between earnings and share prices, which highlights that the performance of the stock market (in this case the S&P 500) is closely tied to the constituent companies’ aggregated forward-looking earnings per share (EPS). In other words, the stock market closely tracks the overall profitability of each company within the index, as measured by analysts’ forecasts of companies’ earnings in 12 months.
Over the long term, the best indicator of stock market performance is the company’s earnings growth.
What we’ve been reading:
- Antipodes: Tomorrow’s winners; five mispriced opportunities
- Castle Point: Recent Studies show that Passive Investing now Outweighs Active Investing
- Franklin Templeton: A Vote for Value Stocks in 2024
- Investment News: S&P Data Shows Average NZ Active Manager Outperforms
- Markets with Madison: How the Bitcoin Halving Could Boost its Price Further
- Milford: Bonds. Corporate Bonds
- Mint: Macro Outlook 2024
- Octagon: Signal to Noise: What’s Material When Investing
- Salt: You Gotta Know When to Hold ‘em