

InvestNow Market Wrap-Up: October 2023
Written by Jason Choy, InvestNow Senior Portfolio Manager
Market Dashboard
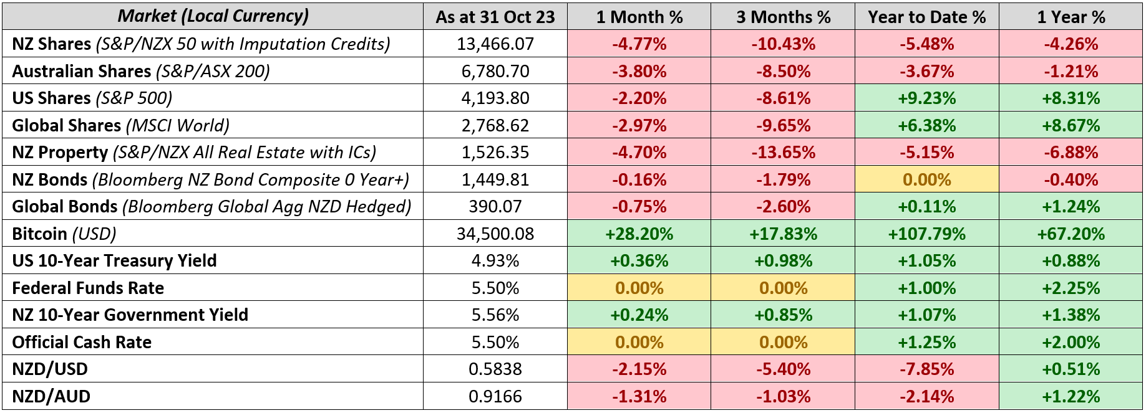
Share and bond markets worldwide continued their declines for a third consecutive month as valuations continued to be pummelled by sharp increases in long-term government bond yields amid robust economic data, particularly out of the US. Geopolitical concerns following the outbreak of war between Israel and Hamas also added to volatility over the month.
Global Markets Summary: October 2023
Another month in the red for global markets: Global markets saw a continuation of the trend seen in recent months with both share and bond markets diverging once again from their natural negative correlation to both finish lower over October. The sentiment was driven by another bout of ‘good news is bad news’ for markets, where generally positive economic data was met with disdain from investors as it signalled perhaps a longer runway for elevated interest rates. Against this backdrop, the MSCI All Country World Index declined -3.0% over the month in USD terms, with developed markets (-2.9%) faring better than emerging markets (-3.9%), while growth stocks (-2.4%) won the battle over their value counterparts (-3.4%), although all were comfortably in the red.
Rare third straight monthly decline for US Stocks: October saw a flurry of data outlining the resilience of the US economy, including a blockbuster jobs report, strong retail sales and GDP growth well ahead of expectations. This robust data, combined with US inflation remaining at 3.7% (versus expectations of a moderation) pushed out the date for the expected end of the Federal Reserve’s tighter monetary policy environment which weighed on stocks. The S&P 500 would go on to finish October down -2.2% and notch its third consecutive month in the red, a rarity only experienced two other times over the past decade. The US large-cap benchmark would still be the best– performing major equity market over the month, and while the S&P 500 is still up 9.2% year-to-date, it was up around double this just a couple of months ago.
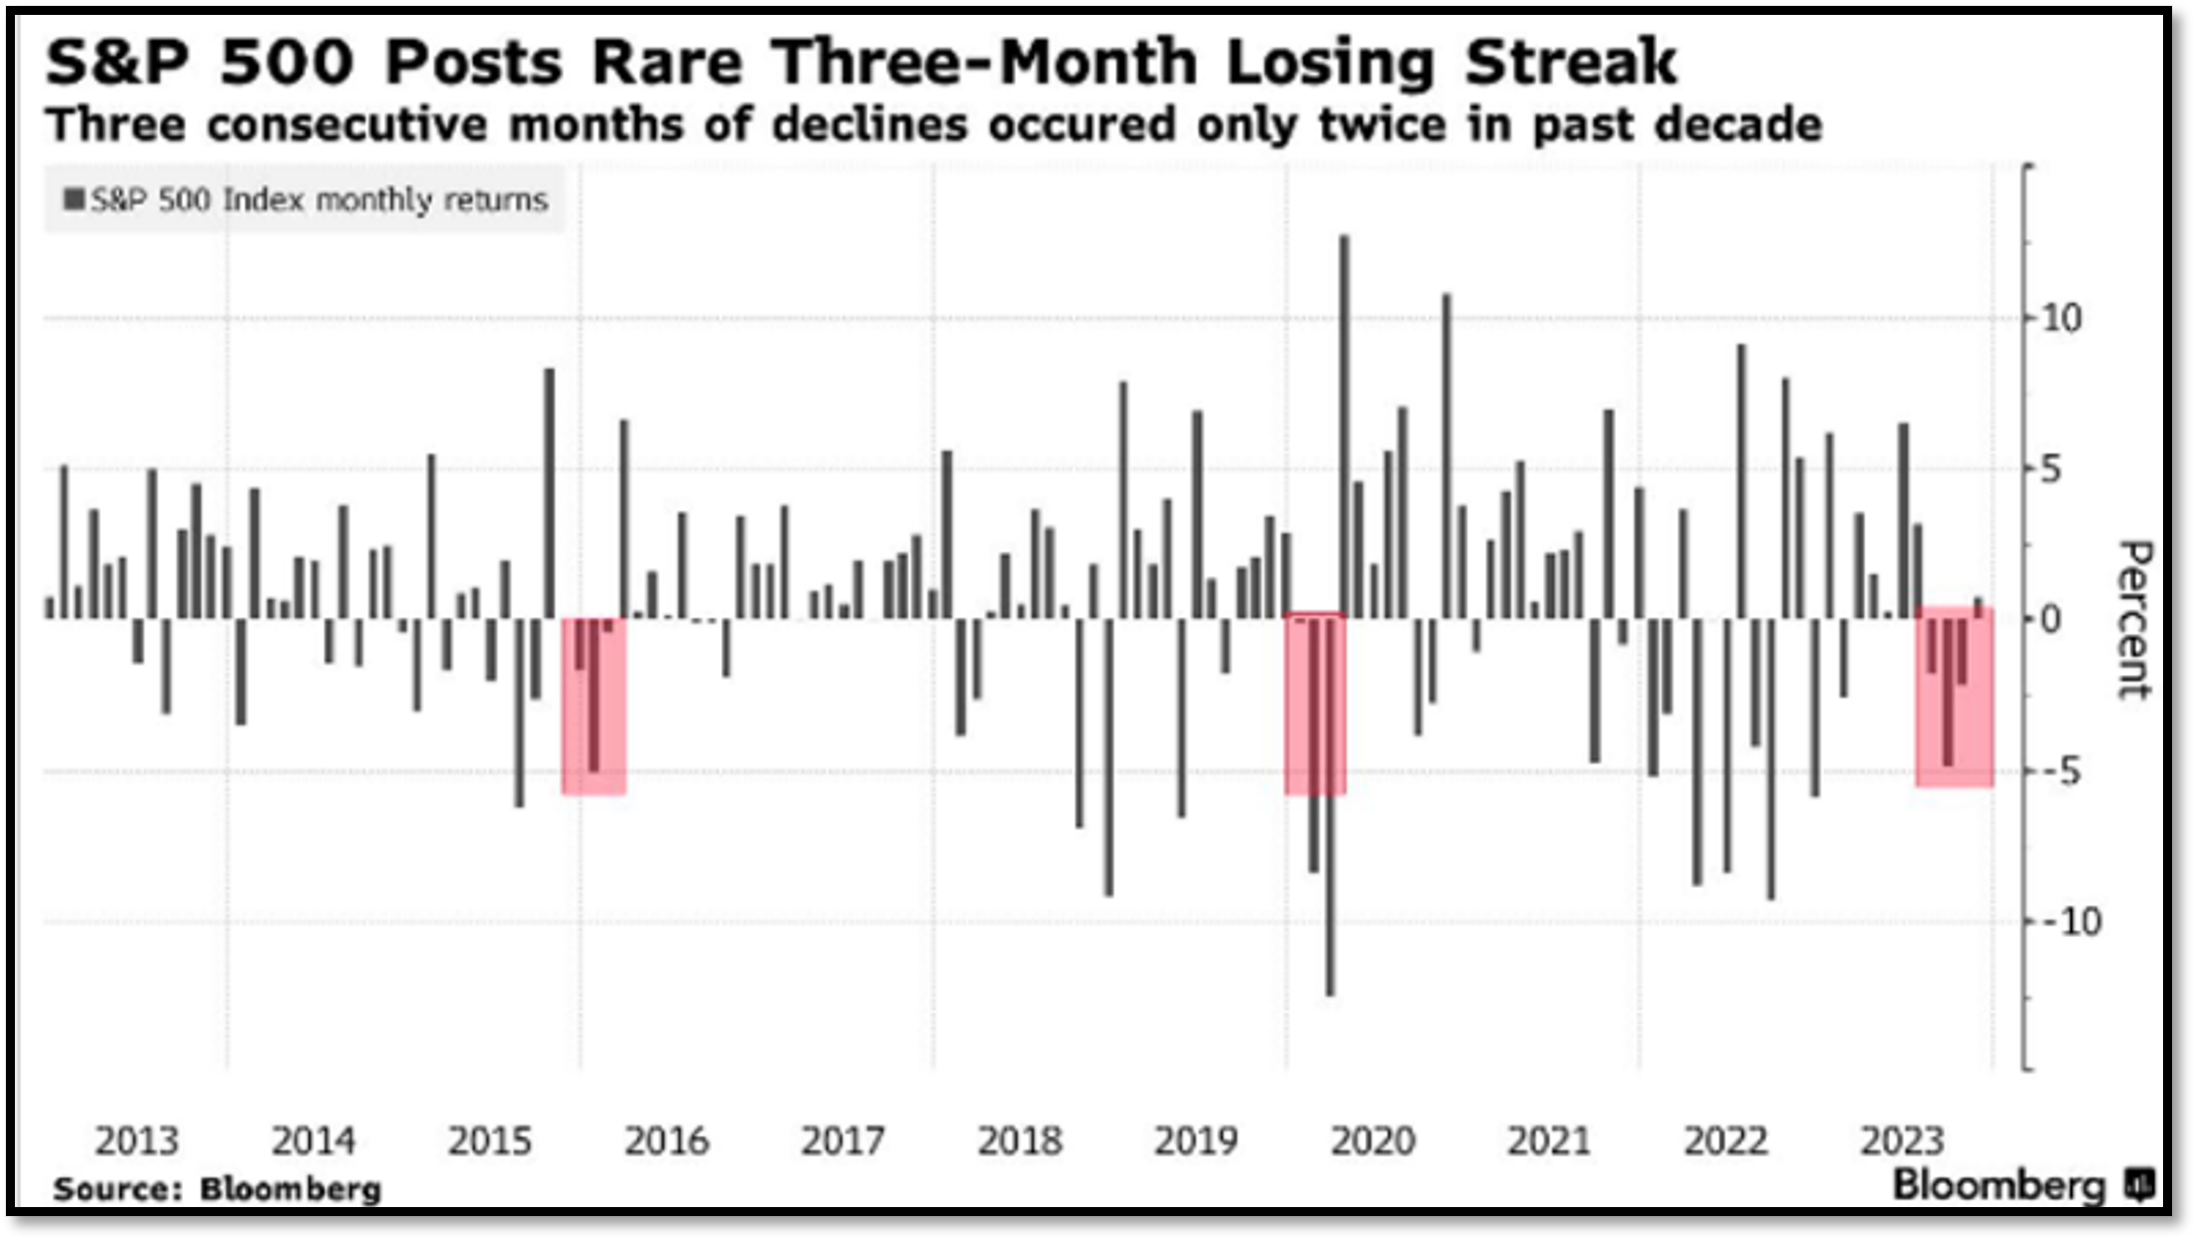
October saw three straight months of declines for the S&P 500 – a rare sight not even seen in 2022 when markets saw one of its worst– performing years in a generation.
Wider developed markets finish lower, although inflation trending in the right direction: European shares declined -3.3% over the month as cracks continued to emerge in the economic outlook for the Eurozone with the supply of credit to households and businesses contracting. This is despite positive signs from the inflation front, with Eurozone inflation falling to 2.9% year-on-year over the month from 4.3% in September, which saw the European Central Bank hold interest rates steady at their October meeting for the first time in 10 months. UK stocks fared worse, down -4.1% over the month amid sharp drops in retail spending and consumer confidence, which were weighed down by concerns that interest rates may be elevated for longer as UK inflation remains slow to retreat, clocking in at 6.7% year-on-year in October.
Geopolitical risk rises with the outbreak of the Israel-Hamas war: The tragic events that unfolded in the Middle East led to an initial flight from riskier assets to traditional safe havens such as gold, with investors fearing the potential for a broadening conflict. Oil prices also rallied amid concerns that any escalation could disrupt the oil supply, although prices were still off September’s peaks. Wars often get a lot of press in the media and can incite fear or knee-jerk reactions from investors, and while there is still the potential for further geopolitical risk impacting markets, for many investors the impact of events like wars on their long-term investment goals and approach is likely more muted. Many investors have often found they are well-served remaining invested and staying the course of their long-term investment strategies, rather than fleeing to cash at the first signs of conflict arising.
Asian and emerging markets continue to search for momentum: All Asian share market indices ended October in negative territory as unconvincing economic data and geopolitics weakened sentiment. Chinese shares fell again as investors remain sceptical Beijing has done enough to manage weakness in the real estate sector, despite some positive retail sales news and warming of US-China relations following a confirmed meeting between Biden and Xi. Japanese shares also fell -3% with its growth and small caps stocks in particular struggling amid weakening sentiment from increasing bond yields. Emerging markets also struggled, being more directly impacted by the conflict erupting out of the Middle East.
Global Bonds continue their ascent: Throughout October, the prevailing narrative driving bond markets was the expectation that interest rates would need to remain higher for longer. This saw US bond yields breach the psychologically important 5% threshold in multiple tenors over the month for the first time in 16 years, with the US 10-Year climbing 36 bps over October. European rates outperformed other markets as yields fell over shorter maturities with confidence growing that Eurozone inflation is on track back to the 2% target. Meanwhile, the UK saw a steepening of its yield curve following pessimistic consumer sentiment, with the UK 10-Year increasing by 8 bps to 4.52% while the 2-Year decreased by 12 bps to 4.78%.
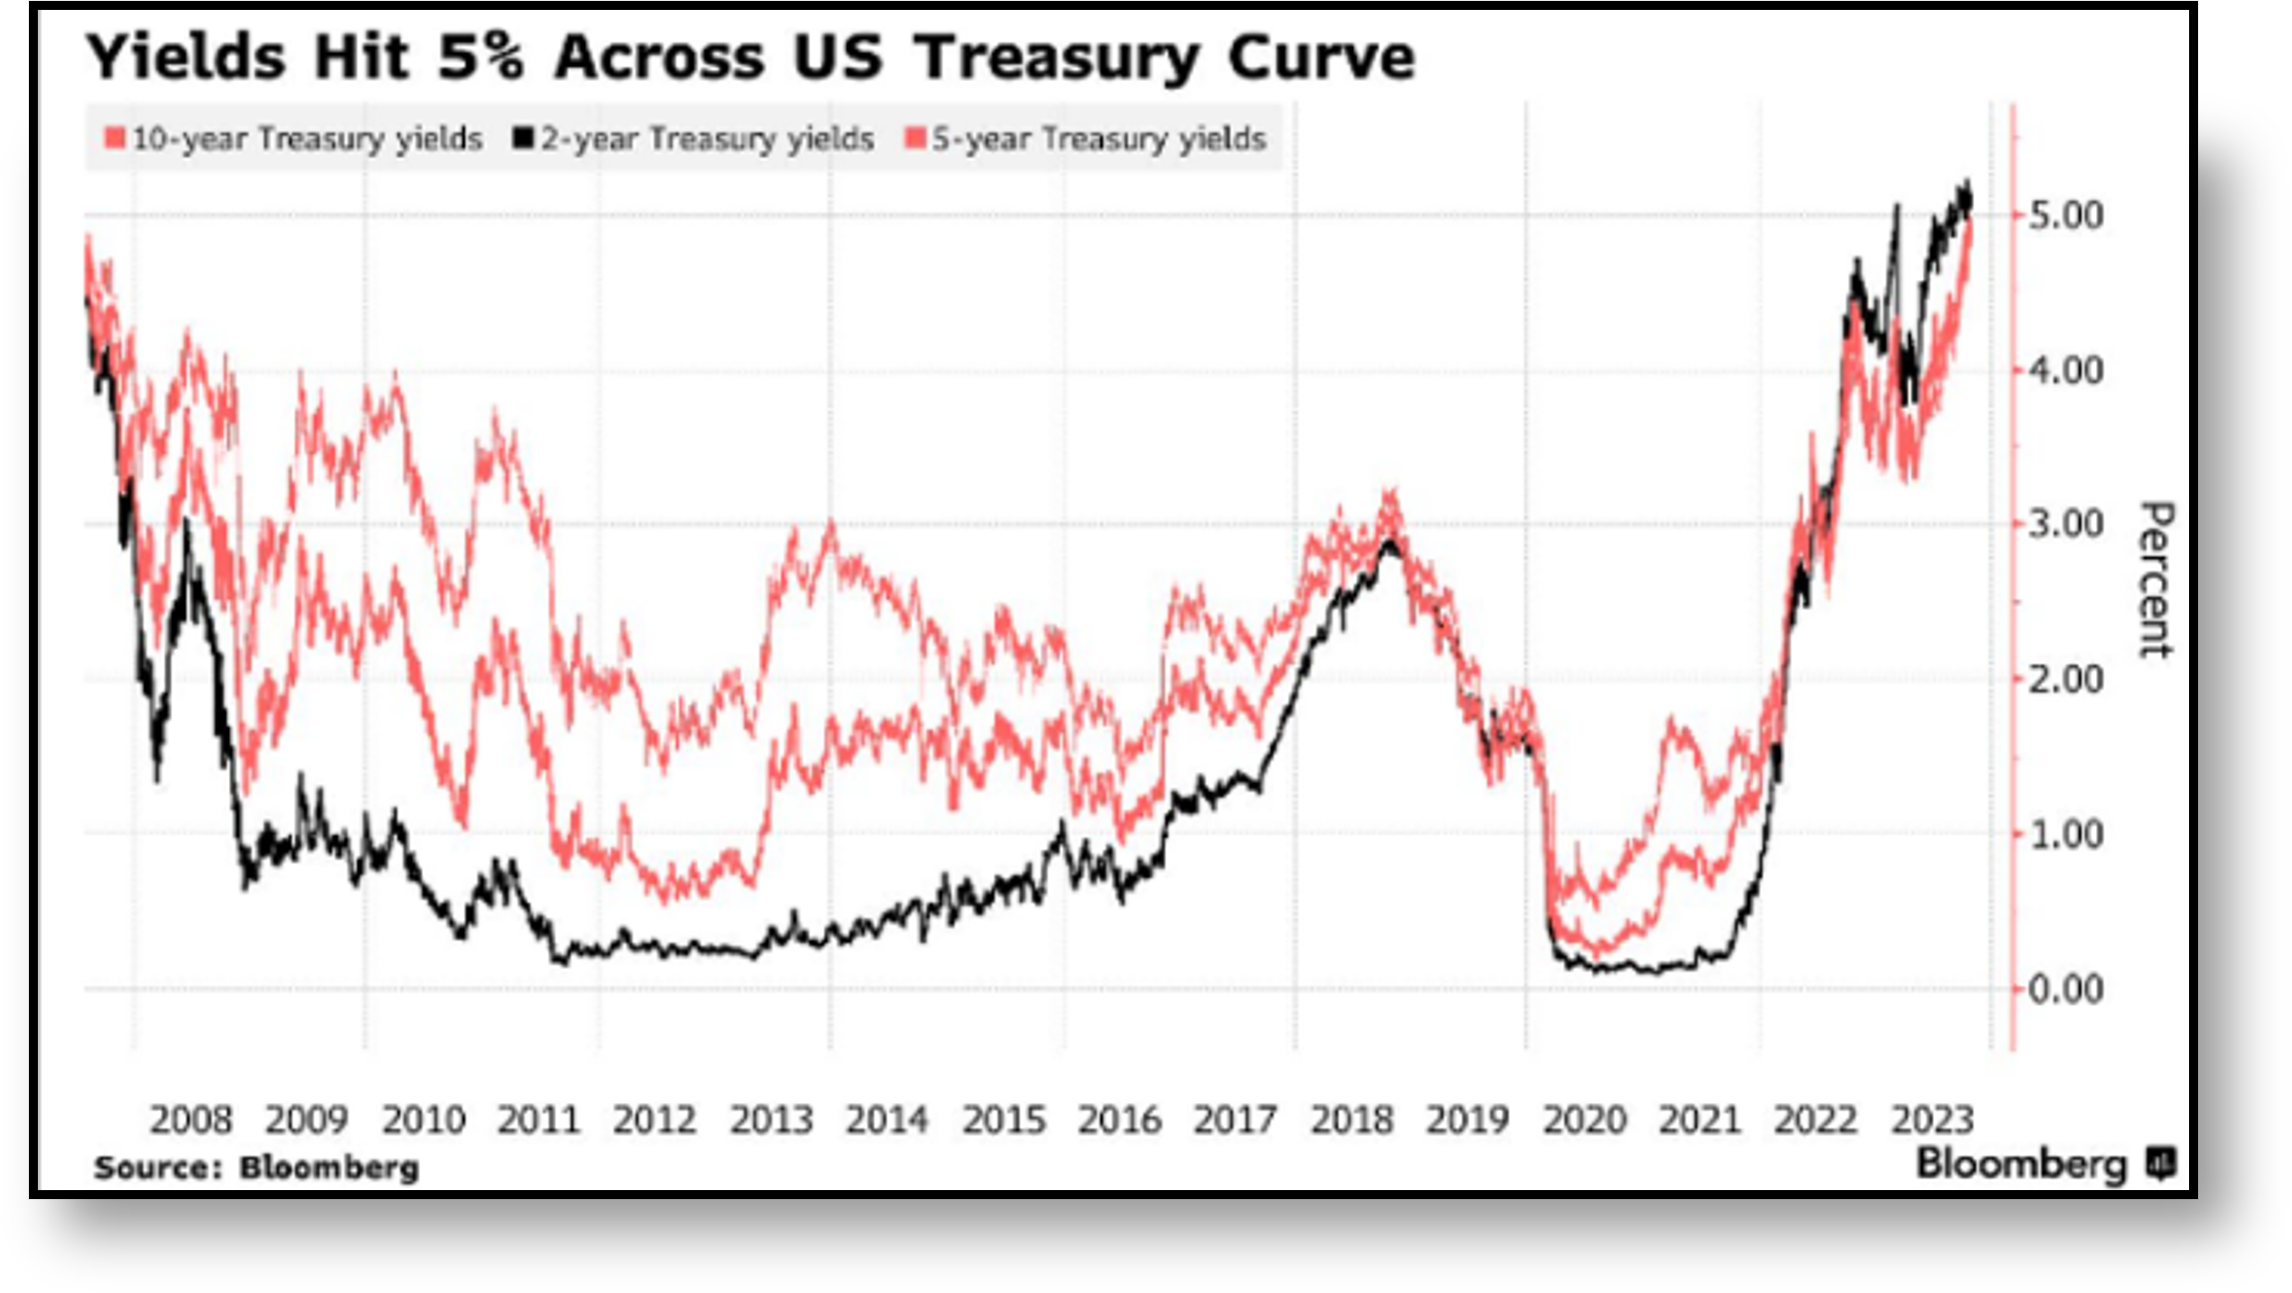
US bond yields hit the psychologically important 5% threshold over October for the first time since 2007.
Key updates for the Kiwi investor:
New Zealand share market lags global counterparts: The S&P/NZX 50 Gross Index (with imputation credits) fell 4.8% in October, impacted by sharply increasing long-term government bond yields, which caused equity markets to be revalued downwards. Notable local data releases over the month included annual core inflation dropping from 5.7% to 5.2% in Q3, while business surveys also showed that the labour market has loosened materially off the back of higher migration. Business confidence in NZ remains mixed however, with the latest Financial Stability Report from the Reserve Bank of New Zealand highlighting that five major NZ banks see non-performing loans doubling by early 2025. Australia also saw a similar rocky sentiment, with the S&P/ASX 200 Index falling -3.8% in Australian Dollar terms.
Local bonds follow global yields higher: NZ bond yields continued to climb, with the NZ 10-Year Government Bond adding a further 24 bps over October to finish at 5.56% – levels unseen in over 12 years. The Reserve Bank of New Zealand was, once again, happy to hold the Official Cash Rate at 5.5% over the month, acknowledging that tight monetary policy was working as required, with the central bank viewing the near-term risk of activity and inflation not slowing as much as needed being offset by the risk of a greater than anticipated slowdown in global demand. This saw the Bloomberg NZ Bond Composite 0+ Yr Index return -0.2% in October, with higher yields putting a drag on the capital return element for bonds.
NZ election results – what does the new government mean for Kiwi investors? October saw the New Zealand general election come and go, with the majority of Kiwis demanding change as the ‘blue-nami’ swept across the country and resulted in National and new Prime Minister Christopher Luxon taking power. A historic three-party coalition with ACT and New Zealand First will see a right-leaning government shape policy once again, but how much will the election results actually impact Kiwi investors?
Headline share market returns historically favour National: Looking at the performance of the NZ equity market dating back to 1957, Forsyth Barr’s analysis found that the immediate 3-month period post-election saw National-led governments generate a positive return on average (+1.5%), while Labour-led governments saw negative returns (-3%). Team Blue also came out on top across the entire 3-year government term, with National-led governments generating an 8.3% annualised return on average, while Labour-led governments only clocked up about a quarter of this at 2.2%.
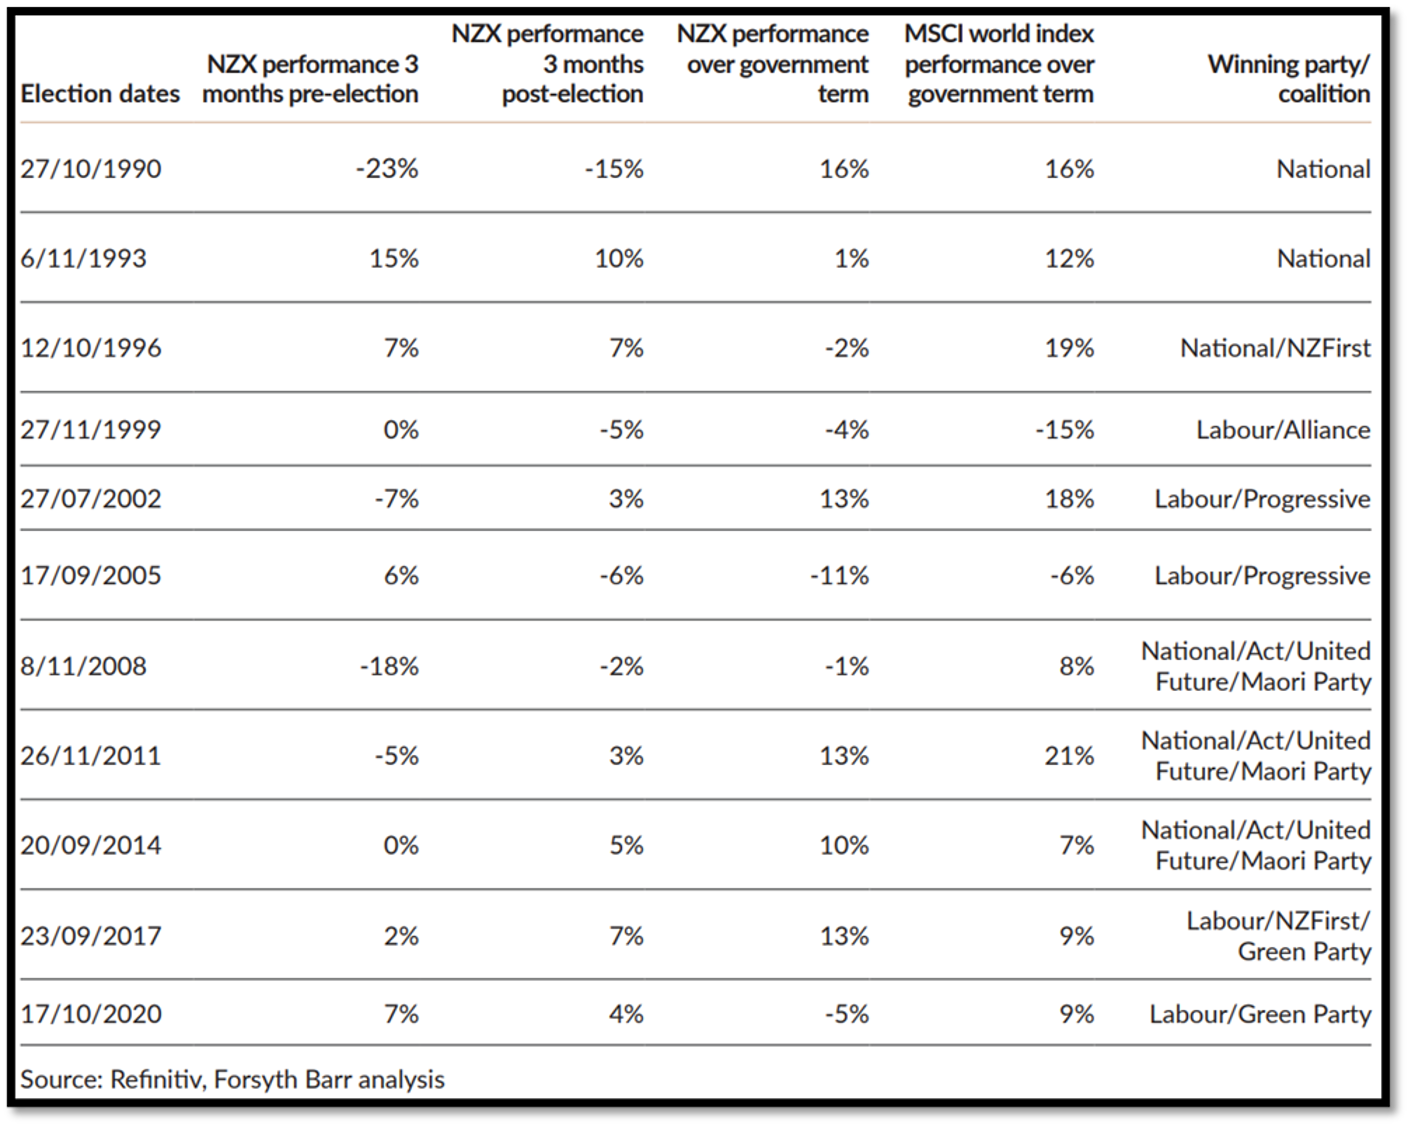
The NZ equity market has historically performed better in National-led governments compared to Labour-led ones, both in the immediate quarter post-election but also across the entire 3-year government term.
Correlation versus causation: be wary of investing based on colour – Investors however should be wary of arriving at any foregone conclusions from comparing headline returns between different governments. Labour certainly drew the short straw in the historic returns comparison, having been in power during major market crashes such as the 1987 stock market crash, the dot-com bubble and the global financial crisis. Moreover, many other factors impact equity market performance that are often completely unrelated to who the government of the day is. Historically, there have been strong and weak periods of performance under both National and Labour-led governments, so investors should be wary of chasing any notions of guaranteed returns simply due to the fact we have a changing of the guards over in Wellington.
Policy: the devil in the details – While investors shouldn’t expect any significant market impacts simply due to the colour of the government in charge, occasionally the government can have a material impact on specific listed companies through the policy that is enforced. Specifically, National’s tax policy to reinstate interest deductibility for rental properties and reduce the bright-line test for capital gains have been favourable for the aged care sector as well as building-exposed names on the NZX, given anticipated increases in property prices. The NZ agricultural sector could also benefit given National’s friendly stance towards farmers. For well-diversified investors however, exposed across sectors and asset classes, the impact of government policy on market performance will be more muted.
Post-election time means back to business for Kiwi investors: Despite the government-related considerations discussed above that could have some impact at the margin, for the most part, the biggest impact on financial markets post-election is simply the fact that the election is over. Markets tend to breathe easier once the election is out of the way, as less uncertainly is typically well-received by markets. Overall though for investors with medium to long-term horizons, elections generally come and go without much lasting impact. It is hard to determine whether political outcomes will definitively sway markets one way or another, so for most investors, focusing on factors such as their investment goals, time horizon and asset allocation will have a much greater impact over the long term on portfolio outcomes compared to the musical chairs game over at the Beehive.
Chart of the month:
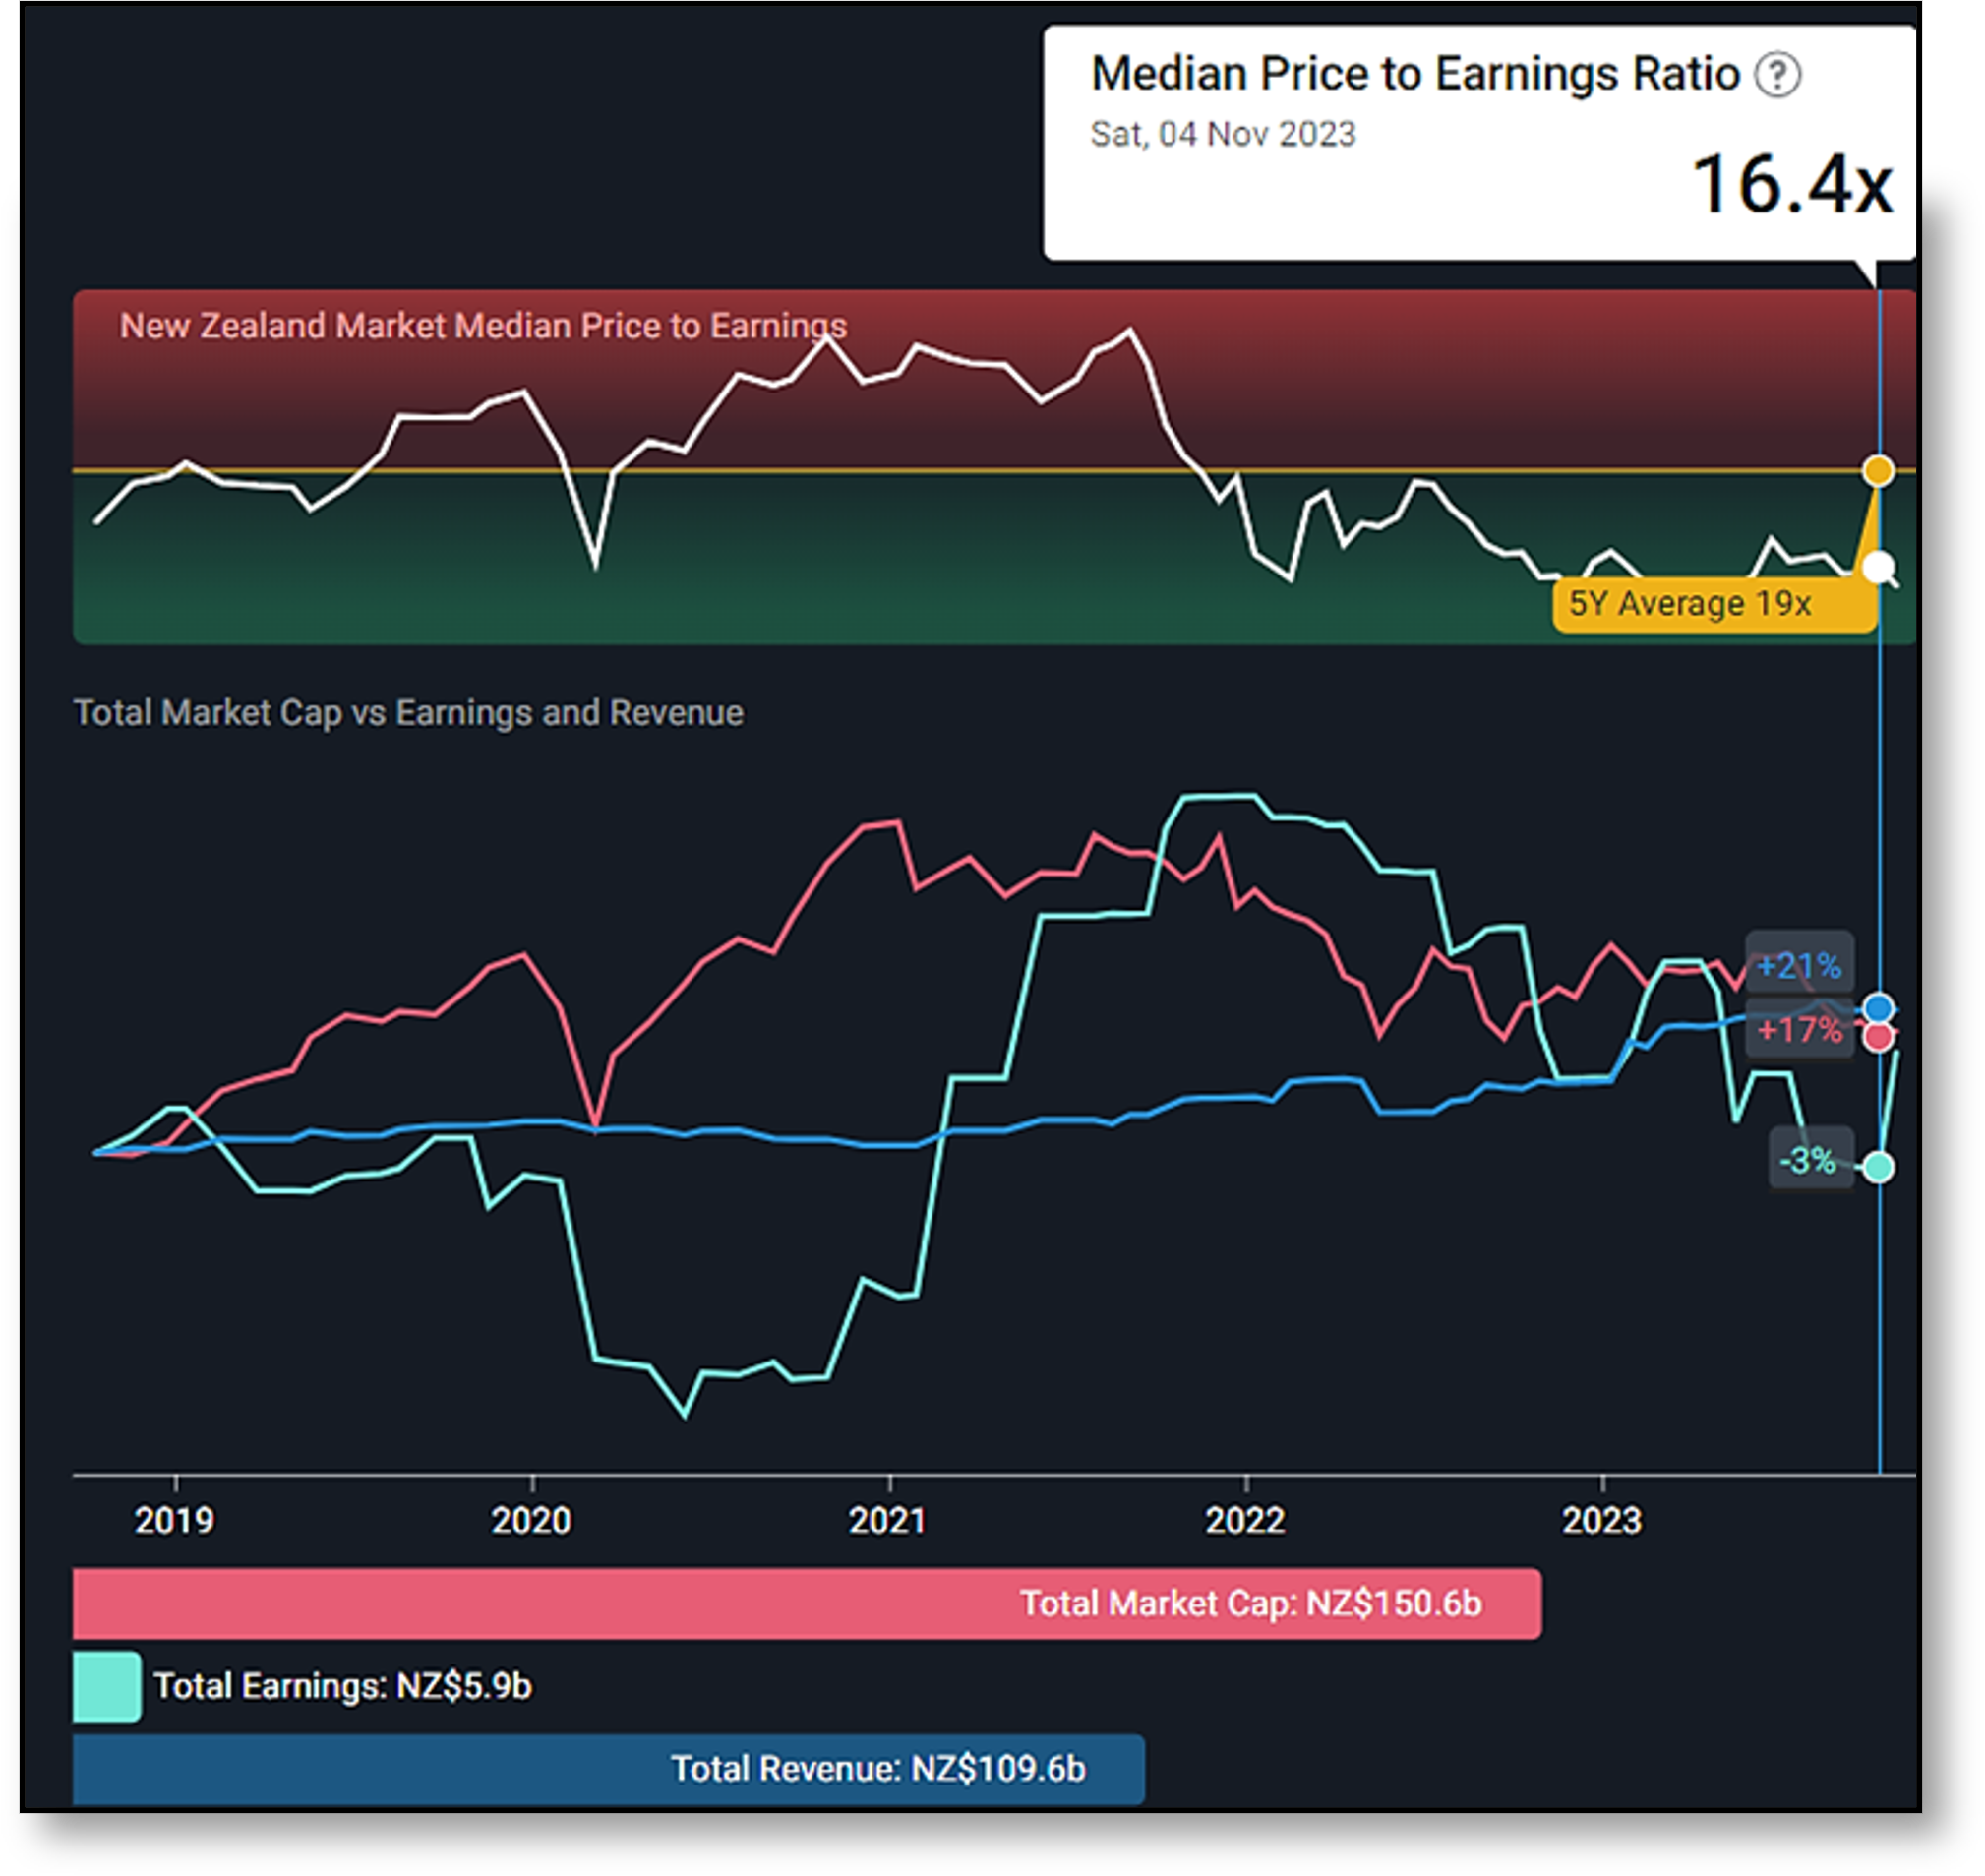
Salt Funds Management highlights that the NZ equity market is looking less-over-valued (although still not cheap) based on the ‘Rule of 20’ heuristic for determining fair value.
Our Chart of the Month is from Salt Funds Management, which compares the forward P/E ratio (or ratio of a company’s current share price to its projected earnings) for the median NZ company versus the total NZ stock market, and whether this makes the NZ equity market attractive from a fair valuation perspective (i.e. whether NZ shares currently appear over or undervalued).
The P/E ratio of 16.4x for the median NZ company is well below the wider NZ stock market, which has a P/E ratio of 25.5x ($150.6b price over $5.9b earnings). This points to a handful of larger, highly valued NZ companies pulling up the overall P/E ratio, but also means there could be quite a few pockets within the NZ share market where stocks are undervalued.
The ‘Rule of 20’ heuristic speaks to the NZ equity market being fairly valued to slightly expensive overall. The ‘Rule of 20’ is a rule of thumb employed by fund managers to determine how over or undervalued stocks are within a sector. Stocks are considered fairly valued when the sum of the market’s forward P/E ratio and year-over-year change in the consumer price index (CPI) is equal to 20; inexpensive when below 20; and expensive when above 20. Salt highlights that in NZ, that number at the end of October is 22 (16.4 Median P/E + 5.6% CPI) which speaks to NZ equities being fair-value to slightly expensive.
Salt’s view is that a changing value paradigm means that the main risk to NZ equities has changed from being bond yields to earnings downside risk. Previously increasing bond yields weighed down on NZ stocks due to the higher return required to take on risk. Salt notes however with bond yields high in real terms and likely with less upside left, the risk to NZ share valuations now sit with earnings coming in lower than expected, which would naturally bring share prices down if P/E ratios remain relatively stable.
This highlights one of InvestNow’s Investing Principles – Understand the Risks of different asset classes and the fundamental behaviours that drive their valuations (and therefore returns). It is important for investors to understand the relationship between risk and reward and particularly how this determines an investment’s value. Insight into how professional fund managers like Salt view assets and determine value through tools like P/E ratios and the ‘Rule of 20’ are helpful context for investors to screen the validity of any investment opportunities and to avoid blindly diving into the next hot investment trend.
What we’ve been reading:
- Castle Point: The Bond Market gives investors a High Five
- Elevation Capital: Adobe Research Report
- Fisher Funds: Investing Lessons from the World Cup
- Franklin Templeton: Fourth Quarter 2023 Global Outlook
- Harbour: Impact Report 2023
- Mercer: Investing in Systematic Equities: A Primer
- Milford: The Principles of Good Stewardship
- Octagon: Waiting for Winston, a tragicomedy brought to you by MMP
- Salt: Global Bonds and Active Portfolio Choices
- Squirrel: Why Continued High Interest Rates aren’t all Bad News
- Vanguard: Why Bonds Beat Term Deposits For Long-Term Investors
InvestNow Market Wrap-Up: October 2023
Written by Jason Choy, InvestNow Senior Portfolio Manager
Market Dashboard
Share and bond markets worldwide continued their declines for a third consecutive month as valuations continued to be pummelled by sharp increases in long-term government bond yields amid robust economic data, particularly out of the US. Geopolitical concerns following the outbreak of war between Israel and Hamas also added to volatility over the month.
Global Markets Summary: October 2023
Another month in the red for global markets: Global markets saw a continuation of the trend seen in recent months with both share and bond markets diverging once again from their natural negative correlation to both finish lower over October. The sentiment was driven by another bout of ‘good news is bad news’ for markets, where generally positive economic data was met with disdain from investors as it signalled perhaps a longer runway for elevated interest rates. Against this backdrop, the MSCI All Country World Index declined -3.0% over the month in USD terms, with developed markets (-2.9%) faring better than emerging markets (-3.9%), while growth stocks (-2.4%) won the battle over their value counterparts (-3.4%), although all were comfortably in the red.
Rare third straight monthly decline for US Stocks: October saw a flurry of data outlining the resilience of the US economy, including a blockbuster jobs report, strong retail sales and GDP growth well ahead of expectations. This robust data, combined with US inflation remaining at 3.7% (versus expectations of a moderation) pushed out the date for the expected end of the Federal Reserve’s tighter monetary policy environment which weighed on stocks. The S&P 500 would go on to finish October down -2.2% and notch its third consecutive month in the red, a rarity only experienced two other times over the past decade. The US large-cap benchmark would still be the best– performing major equity market over the month, and while the S&P 500 is still up 9.2% year-to-date, it was up around double this just a couple of months ago.
October saw three straight months of declines for the S&P 500 – a rare sight not even seen in 2022 when markets saw one of its worst– performing years in a generation.
Wider developed markets finish lower, although inflation trending in the right direction: European shares declined -3.3% over the month as cracks continued to emerge in the economic outlook for the Eurozone with the supply of credit to households and businesses contracting. This is despite positive signs from the inflation front, with Eurozone inflation falling to 2.9% year-on-year over the month from 4.3% in September, which saw the European Central Bank hold interest rates steady at their October meeting for the first time in 10 months. UK stocks fared worse, down -4.1% over the month amid sharp drops in retail spending and consumer confidence, which were weighed down by concerns that interest rates may be elevated for longer as UK inflation remains slow to retreat, clocking in at 6.7% year-on-year in October.
Geopolitical risk rises with the outbreak of the Israel-Hamas war: The tragic events that unfolded in the Middle East led to an initial flight from riskier assets to traditional safe havens such as gold, with investors fearing the potential for a broadening conflict. Oil prices also rallied amid concerns that any escalation could disrupt the oil supply, although prices were still off September’s peaks. Wars often get a lot of press in the media and can incite fear or knee-jerk reactions from investors, and while there is still the potential for further geopolitical risk impacting markets, for many investors the impact of events like wars on their long-term investment goals and approach is likely more muted. Many investors have often found they are well-served remaining invested and staying the course of their long-term investment strategies, rather than fleeing to cash at the first signs of conflict arising.
Asian and emerging markets continue to search for momentum: All Asian share market indices ended October in negative territory as unconvincing economic data and geopolitics weakened sentiment. Chinese shares fell again as investors remain sceptical Beijing has done enough to manage weakness in the real estate sector, despite some positive retail sales news and warming of US-China relations following a confirmed meeting between Biden and Xi. Japanese shares also fell -3% with its growth and small caps stocks in particular struggling amid weakening sentiment from increasing bond yields. Emerging markets also struggled, being more directly impacted by the conflict erupting out of the Middle East.
Global Bonds continue their ascent: Throughout October, the prevailing narrative driving bond markets was the expectation that interest rates would need to remain higher for longer. This saw US bond yields breach the psychologically important 5% threshold in multiple tenors over the month for the first time in 16 years, with the US 10-Year climbing 36 bps over October. European rates outperformed other markets as yields fell over shorter maturities with confidence growing that Eurozone inflation is on track back to the 2% target. Meanwhile, the UK saw a steepening of its yield curve following pessimistic consumer sentiment, with the UK 10-Year increasing by 8 bps to 4.52% while the 2-Year decreased by 12 bps to 4.78%.
US bond yields hit the psychologically important 5% threshold over October for the first time since 2007.
Key updates for the Kiwi investor:
New Zealand share market lags global counterparts: The S&P/NZX 50 Gross Index (with imputation credits) fell 4.8% in October, impacted by sharply increasing long-term government bond yields, which caused equity markets to be revalued downwards. Notable local data releases over the month included annual core inflation dropping from 5.7% to 5.2% in Q3, while business surveys also showed that the labour market has loosened materially off the back of higher migration. Business confidence in NZ remains mixed however, with the latest Financial Stability Report from the Reserve Bank of New Zealand highlighting that five major NZ banks see non-performing loans doubling by early 2025. Australia also saw a similar rocky sentiment, with the S&P/ASX 200 Index falling -3.8% in Australian Dollar terms.
Local bonds follow global yields higher: NZ bond yields continued to climb, with the NZ 10-Year Government Bond adding a further 24 bps over October to finish at 5.56% – levels unseen in over 12 years. The Reserve Bank of New Zealand was, once again, happy to hold the Official Cash Rate at 5.5% over the month, acknowledging that tight monetary policy was working as required, with the central bank viewing the near-term risk of activity and inflation not slowing as much as needed being offset by the risk of a greater than anticipated slowdown in global demand. This saw the Bloomberg NZ Bond Composite 0+ Yr Index return -0.2% in October, with higher yields putting a drag on the capital return element for bonds.
NZ election results – what does the new government mean for Kiwi investors? October saw the New Zealand general election come and go, with the majority of Kiwis demanding change as the ‘blue-nami’ swept across the country and resulted in National and new Prime Minister Christopher Luxon taking power. A historic three-party coalition with ACT and New Zealand First will see a right-leaning government shape policy once again, but how much will the election results actually impact Kiwi investors?
Headline share market returns historically favour National: Looking at the performance of the NZ equity market dating back to 1957, Forsyth Barr’s analysis found that the immediate 3-month period post-election saw National-led governments generate a positive return on average (+1.5%), while Labour-led governments saw negative returns (-3%). Team Blue also came out on top across the entire 3-year government term, with National-led governments generating an 8.3% annualised return on average, while Labour-led governments only clocked up about a quarter of this at 2.2%.
The NZ equity market has historically performed better in National-led governments compared to Labour-led ones, both in the immediate quarter post-election but also across the entire 3-year government term.
Correlation versus causation: be wary of investing based on colour – Investors however should be wary of arriving at any foregone conclusions from comparing headline returns between different governments. Labour certainly drew the short straw in the historic returns comparison, having been in power during major market crashes such as the 1987 stock market crash, the dot-com bubble and the global financial crisis. Moreover, many other factors impact equity market performance that are often completely unrelated to who the government of the day is. Historically, there have been strong and weak periods of performance under both National and Labour-led governments, so investors should be wary of chasing any notions of guaranteed returns simply due to the fact we have a changing of the guards over in Wellington.
Policy: the devil in the details – While investors shouldn’t expect any significant market impacts simply due to the colour of the government in charge, occasionally the government can have a material impact on specific listed companies through the policy that is enforced. Specifically, National’s tax policy to reinstate interest deductibility for rental properties and reduce the bright-line test for capital gains have been favourable for the aged care sector as well as building-exposed names on the NZX, given anticipated increases in property prices. The NZ agricultural sector could also benefit given National’s friendly stance towards farmers. For well-diversified investors however, exposed across sectors and asset classes, the impact of government policy on market performance will be more muted.
Post-election time means back to business for Kiwi investors: Despite the government-related considerations discussed above that could have some impact at the margin, for the most part, the biggest impact on financial markets post-election is simply the fact that the election is over. Markets tend to breathe easier once the election is out of the way, as less uncertainly is typically well-received by markets. Overall though for investors with medium to long-term horizons, elections generally come and go without much lasting impact. It is hard to determine whether political outcomes will definitively sway markets one way or another, so for most investors, focusing on factors such as their investment goals, time horizon and asset allocation will have a much greater impact over the long term on portfolio outcomes compared to the musical chairs game over at the Beehive.
Chart of the month:
Salt Funds Management highlights that the NZ equity market is looking less-over-valued (although still not cheap) based on the ‘Rule of 20’ heuristic for determining fair value.
Our Chart of the Month is from Salt Funds Management, which compares the forward P/E ratio (or ratio of a company’s current share price to its projected earnings) for the median NZ company versus the total NZ stock market, and whether this makes the NZ equity market attractive from a fair valuation perspective (i.e. whether NZ shares currently appear over or undervalued).
The P/E ratio of 16.4x for the median NZ company is well below the wider NZ stock market, which has a P/E ratio of 25.5x ($150.6b price over $5.9b earnings). This points to a handful of larger, highly valued NZ companies pulling up the overall P/E ratio, but also means there could be quite a few pockets within the NZ share market where stocks are undervalued.
The ‘Rule of 20’ heuristic speaks to the NZ equity market being fairly valued to slightly expensive overall. The ‘Rule of 20’ is a rule of thumb employed by fund managers to determine how over or undervalued stocks are within a sector. Stocks are considered fairly valued when the sum of the market’s forward P/E ratio and year-over-year change in the consumer price index (CPI) is equal to 20; inexpensive when below 20; and expensive when above 20. Salt highlights that in NZ, that number at the end of October is 22 (16.4 Median P/E + 5.6% CPI) which speaks to NZ equities being fair-value to slightly expensive.
Salt’s view is that a changing value paradigm means that the main risk to NZ equities has changed from being bond yields to earnings downside risk. Previously increasing bond yields weighed down on NZ stocks due to the higher return required to take on risk. Salt notes however with bond yields high in real terms and likely with less upside left, the risk to NZ share valuations now sit with earnings coming in lower than expected, which would naturally bring share prices down if P/E ratios remain relatively stable.
This highlights one of InvestNow’s Investing Principles – Understand the Risks of different asset classes and the fundamental behaviours that drive their valuations (and therefore returns). It is important for investors to understand the relationship between risk and reward and particularly how this determines an investment’s value. Insight into how professional fund managers like Salt view assets and determine value through tools like P/E ratios and the ‘Rule of 20’ are helpful context for investors to screen the validity of any investment opportunities and to avoid blindly diving into the next hot investment trend.
What we’ve been reading:
- Castle Point: The Bond Market gives investors a High Five
- Elevation Capital: Adobe Research Report
- Fisher Funds: Investing Lessons from the World Cup
- Franklin Templeton: Fourth Quarter 2023 Global Outlook
- Harbour: Impact Report 2023
- Mercer: Investing in Systematic Equities: A Primer
- Milford: The Principles of Good Stewardship
- Octagon: Waiting for Winston, a tragicomedy brought to you by MMP
- Salt: Global Bonds and Active Portfolio Choices
- Squirrel: Why Continued High Interest Rates aren’t all Bad News
- Vanguard: Why Bonds Beat Term Deposits For Long-Term Investors