
InvestNow Market Wrap-Up: September 2023
Written by Jason Choy, InvestNow Senior Portfolio Manager
Market Dashboard
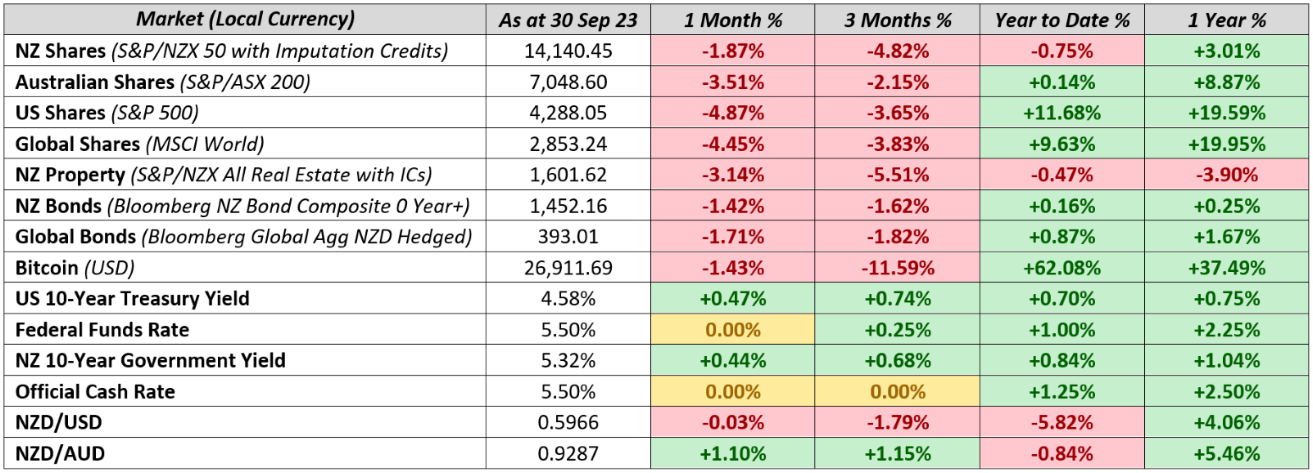
Share and bond indices were down across the board in both local and global markets for the month and quarter ending September. Optimism entering the quarter for an end to high interest rates in the near term were dashed as the months progressed, with the month ending in bond yields taking off.
Global Markets Summary: September 2023
Another September to forget for markets: Global markets extended losses seen in August as a sea of red swept both local and international share markets in September, in what has historically been one of the worst performing months for markets. While there isn’t much statistical evidence to prove the ‘September Effect’ (as some market observers have coined it) to be more than mere coincidence – there was certainly a clear culprit for the most recent September’s losses. Surging bond yields ignited a market sell-off, as the ‘higher for longer’ narrative for the path of interest rates firmly entrenched itself within investor sentiment. Against his backdrop, the MSCI All Country World Index declined 4.1% over the month in USD terms, with developed markets (-4.3%) faring worse off compared to emerging markets (-2.6%).
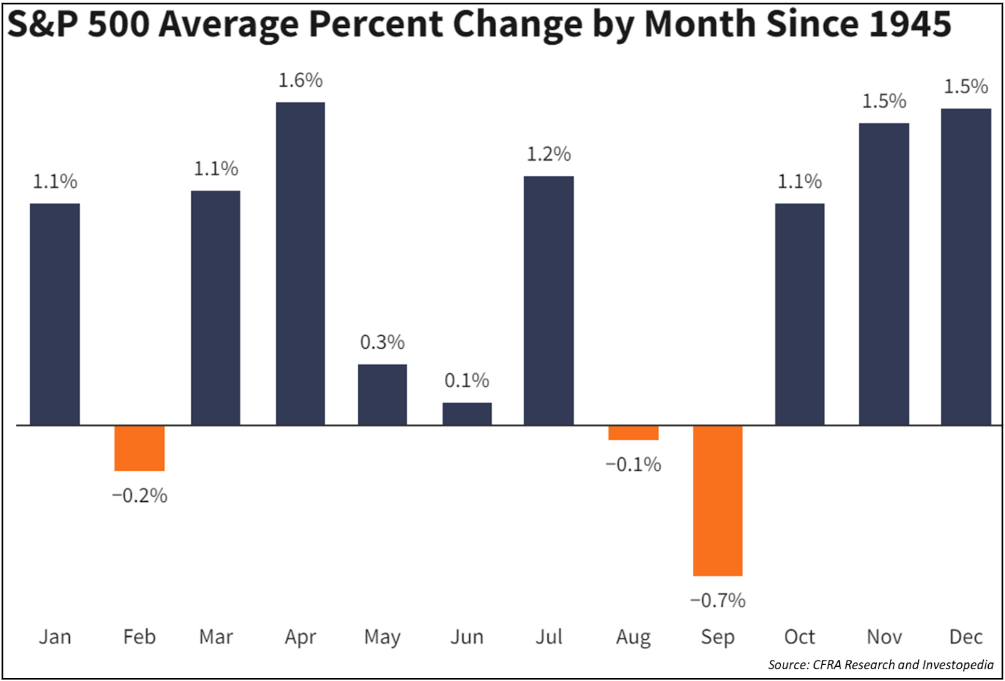
The so-called ‘September Effect’ – where markets have historically performed worst in the month of September struck again in 2023.
US Stocks finish deep in the red: The US Federal Reserve (Fed) upgraded its economic forecasts over the month, with Q3 GDP tracking at close to 5% year-on-year growth – far and away from the unanimous calls for a recession that dominated markets not long ago. The hotter-than-expected indicators saw the prospect of a sustained period of high interest rates sink in, with Fed policymakers signalling a further rate hike to come before year end to offset sticky inflation. The trifecta of ‘higher for longer’ interest rates, rising oil prices, and increasing bond issuance to address a growing US budget deficit fuelled a sharp increase in bond yields, which saw the S&P 500 (-4.9%) and NASDAQ (-5.8%) both tumble to their worst monthly finish in nearly a year.
Why rising bond yields lead to lower equity returns: US 10-Year Treasury yields climbed 46 bp over the month to finish at 4.57% – its highest level since 2007. Despite bonds sitting firmly in the fixed income asset class, even equity-only investors should be aware of movements in the bond market, due to their pronounced impact on growth assets like shares. Increasing bond yields generally lead to lower equity returns as bonds suddenly look more attractive compared to stocks – why invest into risky stocks if you can generate a strong return with much lower risk through bonds? Higher bond rates also mean higher borrowing costs for companies, which also reduces their valuations as profit margins become squeezed.
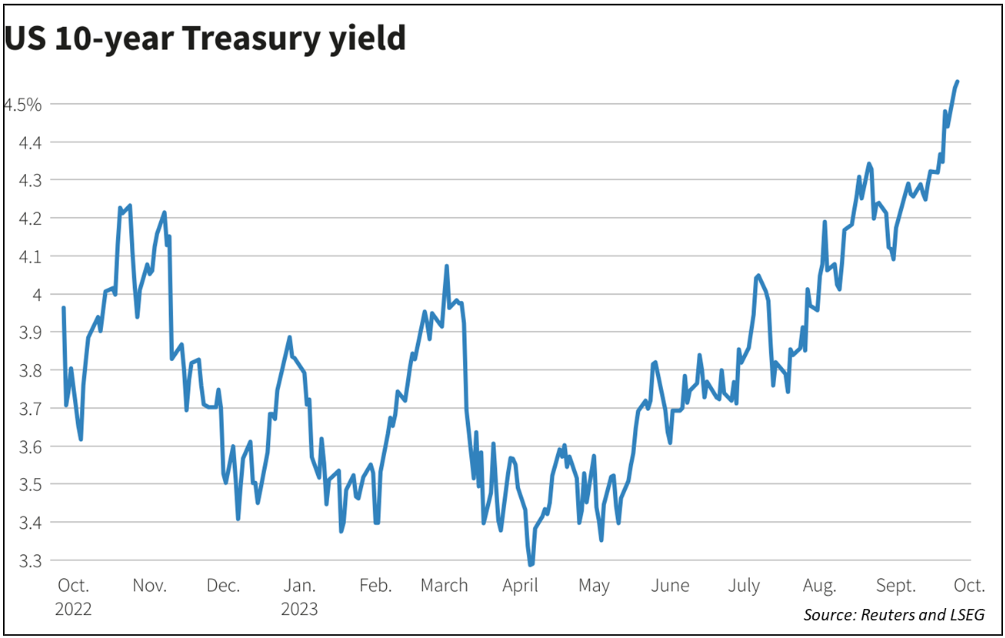
The US 10-Year Treasury Yield – the market’s bellwether interest rate indicator – has continued its dramatic ascent in 2023, reaching 16-year highs and bringing equity valuations down with it.
Pressure begins to ease elsewhere in developed markets: The Eurozone was met with some good news to end the month as inflation slowed to a two-year low of 4.3% in the year to September, down from 5.2% in the previous month. European shares still fell over the quarter though off the back of two interest rate hikes by the European Central Bank (ECB) over the period. However, sentiment appears to have turned the corner with the ECB indicating that its tightening cycle may be finished – seemingly pleased with the current level of interest rates in its fight against inflation. A similar narrative was seen in the UK, with consumer confidence increasing on hopes that rates have peaked, as the Bank of England held rates steady in September which saw UK stocks finish the quarter higher, bolstered by a strong energy sector.
Asian and Emerging Markets more subdued: Most Asian markets declined to end the September quarter over concerns in the Chinese property sector and wider Chinese economy. While data release towards the end of September indicated that Beijing’s policy stimulus provided more support than anticipated, markets aren’t holding their breath for a rebound anytime soon. The Hong Kong, Taiwan and South Korean markets dragged lower, while the Japanese equity market was a notable exception, returning a modest 2.5% higher over the quarter, driven by robust small-cap performance. Wider emerging markets also largely ended lower, caught in between a strong US economy on the one hand (raising concerns rates will stay elevated) and the potential for prolonged ongoing weakness in the Chinese economy on the other.
Global Bond Yields Lift-Off: Led by the US, global government bond yields peaked in September before retreating ever so slightly to end the month. While the quarter began with optimism that central banks have manged to orchestrate a ‘soft landing’ for the economy, enthusiasm withered as the months went on as it became clear that interest rates were set to remain elevated for longer than hoped. The September quarter saw a 76 bp lift in the US 10-Year, and a notable 45bp increase in Germany’s 10-Year, although the UK managed to buck the trend and mostly remain unchanged over the period. Overall, this saw the Bloomberg Global Aggregate Bond Index (hedged to NZD) return -1.7% amid a rising USD.
Key updates for the Kiwi investor:
New Zealand share market continues to struggle: The S&P/NZX 50 fell -1.9% over the month, as concerns rose about whether the Reserve Bank of New Zealand (‘RBNZ’) still has more rate hikes up their sleeve, following stronger than anticipated economic GDP data. This compared more favourably relative to our Trans-Tasman colleagues, where the S&P/ASX 200 benchmark index fell -2.8% over the month as inflation in Australia ticked higher to 5.2% year-on-year, while their economy grew a robust 2.1%.
Local bonds were also negative: NZ bond yields followed their global counterparts higher, with the local NZ 10-Year Government Bond Yield crossing the 5% threshold for the first time in 12 years, ascending 43 bp over the month and finishing at 5.32%. The market reacted to the potential for a higher path following upside surprises to NZ’s economic growth over the quarter above and beyond the RBNZ’s forecast. Overall, this saw the Bloomberg NZ Bond Composite 0+ Yr Index return -1.4% in September, as higher yields mean lower bond prices, which drag on total returns.
No more recession for NZ – but we’re not out of the woods yet: Grant Robertson announced in September that the NZ economy was on the mend, with a revised March quarter GDP figure showing NZ never entered a technical recession, while the June quarter GDP figure outlined growth of 0.9%, for an annual growth rate of 3.2%. The Q2 growth figure compared favourably against the OECD average of 0.5% and brought the NZ economy 7.7% larger than it was pre-pandemic. With such robust growth figures, why are some market commentators so wary that we’ve yet to turn the corner?
Economic conditions remain tough for many Kiwis: While New Zealand, like many countries worldwide have been able to avoid a recession, there is no doubt that economic conditions and the cost of living crisis continue to plague many Kiwis. The impact of rising interest rates often has a lag before it is fully reflected in the economy, as consumers take time to re-fix mortgages and adjust their spending accordingly. Kiwis that fixed their mortgages during the Covid-era lows are facing mortgage re-fixes at levels they were stress tested by their banks at.
With economic data, the devil is in the details: Despite overall GDP figures growing, for many individual Kiwis in the real world, it still feels like a recession. For if we dig into the details, we can see that the main contributors to GDP growth were led by business services and expenditure, while retail trade, accommodation and restaurants – or spending from the average Kiwi – were all down.
Positive data doesn’t necessary mean positive markets – Data releases are helpful indicators of where the economy is heading, but they aren’t the end-all be-all of how markets will perform. Avoid assuming that positive economic news means going all-in on markets to squeeze out the most return, and vice-versa in looking to avoid markets when economic headlines are less forthcoming, as markets can often have counterintuitive reactions to positive or negative news.
Focus on building consistent investing habits, rather than solely reacting to economic headlines: Many investors will be well-served by focusing on building towards their long-term investment goals, rather than pursuing the first gut-reaction that headlines attempt to garner. Empirical evidence shows that developing a good habit of investing what you can and doing so regularly, is a great way to build long-term wealth.
Chart of the month:
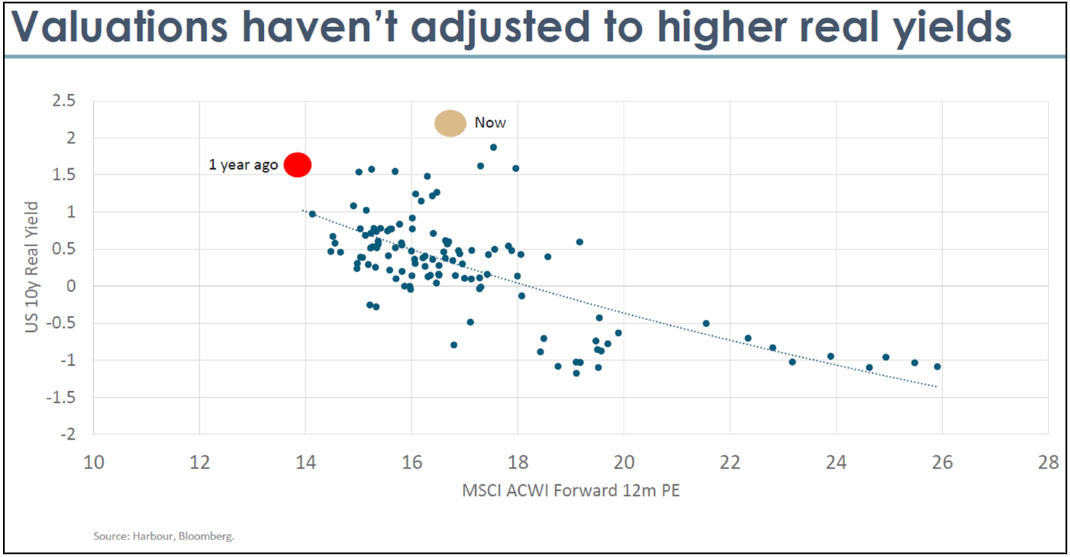
Harbour Asset Management highlights current market trends have deviated away from the traditional inverse relationship between real bond yields and share market valuations.
Our Chart of the Month is from Harbour Asset Management with data from Bloomberg, which outlines the relationship between the US 10-Year Real Bond Yields (yields less inflation) and the Forward P/E ratio (or ratio of current share price to forecasted earnings) of the MSCI All Country World Index.
In general, bond yields and stock valuations have an inverse relationship: As bond yields increase then shares decrease and vice-versa. This is because as real bond yields increase, shares become less attractive as investors can earn a higher level of returns (relatively speaking) through much safer bonds, rather than rolling the dice on the much-riskier equities. Rising bond yields thus provides a drag on equity demand, so the price of shares will go down, which brings the P/E ratio down with it as the ‘P’ numerator decreases.
Harbour notes however that the traditional bond-equity dynamic has yet to hold in 2023: The red dot represents the bond yield-equity value relationship from a year ago. Fast forward to present day though in the yellow dot and while real yields have increased, so too have share market valuations. Harbour points out that this highlights potential over exuberance in market valuations, with scope for a lower re-pricing of shares. Harbour is thus currently defensive positioned (underweight equities or holding less shares than the benchmark) within their Active Growth Fund.
This highlights the potential validity of different investing styles – active management through experienced investment firms like Harbour, Milford and Fisher Funds can play a valuable role in adding value to a fund by incorporating well-research market insights into portfolio positioning. Equally though, following a passive or index-tracking approach to investing is also valid if you were say more fee conscious.
You don’t have to stick with just one investing approach! Different investing styles can be complementary – you could construct a primarily passive approach to save on fees, whilst also having active components to provide potential portfolio outperformance by leveraging the insights of professional managers. Combining different investing approaches is a common way that many institutional asset owners like the NZ Super Fund or ACC invest to great success. With InvestNow’s wide range of fund options across the spectrum of investing styles, tailoring an investment portfolio to your specific needs is super easy to do for all Kiwi investors.
What we’ve been reading:
- Antipodes: Why you need exposure to British stocks
- Devon Funds: Responsible Investment Leader
- Fisher Funds: Buying the dip, explained
- Harbour: The Future of Wealth
- Morningstar: Want to beat the market? Embrace the power of ‘buy and hold’ investing
- MJW: KiwiSaver Market Review
- Nikko: Dire economic outlook should be positive for bonds
- RIAA: Responsible Investment Benchmark Report Aotearoa New Zealand 2023
- Russell Investments: The hidden costs of investing: The tax iceberg
- Salt: Regional Hedge Fund awards put Salt in the mix
InvestNow Market Wrap-Up: September 2023
Written by Jason Choy, InvestNow Senior Portfolio Manager
Market Dashboard
Share and bond indices were down across the board in both local and global markets for the month and quarter ending September. Optimism entering the quarter for an end to high interest rates in the near term were dashed as the months progressed, with the month ending in bond yields taking off.
Global Markets Summary: September 2023
Another September to forget for markets: Global markets extended losses seen in August as a sea of red swept both local and international share markets in September, in what has historically been one of the worst performing months for markets. While there isn’t much statistical evidence to prove the ‘September Effect’ (as some market observers have coined it) to be more than mere coincidence – there was certainly a clear culprit for the most recent September’s losses. Surging bond yields ignited a market sell-off, as the ‘higher for longer’ narrative for the path of interest rates firmly entrenched itself within investor sentiment. Against his backdrop, the MSCI All Country World Index declined 4.1% over the month in USD terms, with developed markets (-4.3%) faring worse off compared to emerging markets (-2.6%).
The so-called ‘September Effect’ – where markets have historically performed worst in the month of September struck again in 2023.
US Stocks finish deep in the red: The US Federal Reserve (Fed) upgraded its economic forecasts over the month, with Q3 GDP tracking at close to 5% year-on-year growth – far and away from the unanimous calls for a recession that dominated markets not long ago. The hotter-than-expected indicators saw the prospect of a sustained period of high interest rates sink in, with Fed policymakers signalling a further rate hike to come before year end to offset sticky inflation. The trifecta of ‘higher for longer’ interest rates, rising oil prices, and increasing bond issuance to address a growing US budget deficit fuelled a sharp increase in bond yields, which saw the S&P 500 (-4.9%) and NASDAQ (-5.8%) both tumble to their worst monthly finish in nearly a year.
Why rising bond yields lead to lower equity returns: US 10-Year Treasury yields climbed 46 bp over the month to finish at 4.57% – its highest level since 2007. Despite bonds sitting firmly in the fixed income asset class, even equity-only investors should be aware of movements in the bond market, due to their pronounced impact on growth assets like shares. Increasing bond yields generally lead to lower equity returns as bonds suddenly look more attractive compared to stocks – why invest into risky stocks if you can generate a strong return with much lower risk through bonds? Higher bond rates also mean higher borrowing costs for companies, which also reduces their valuations as profit margins become squeezed.
The US 10-Year Treasury Yield – the market’s bellwether interest rate indicator – has continued its dramatic ascent in 2023, reaching 16-year highs and bringing equity valuations down with it.
Pressure begins to ease elsewhere in developed markets: The Eurozone was met with some good news to end the month as inflation slowed to a two-year low of 4.3% in the year to September, down from 5.2% in the previous month. European shares still fell over the quarter though off the back of two interest rate hikes by the European Central Bank (ECB) over the period. However, sentiment appears to have turned the corner with the ECB indicating that its tightening cycle may be finished – seemingly pleased with the current level of interest rates in its fight against inflation. A similar narrative was seen in the UK, with consumer confidence increasing on hopes that rates have peaked, as the Bank of England held rates steady in September which saw UK stocks finish the quarter higher, bolstered by a strong energy sector.
Asian and Emerging Markets more subdued: Most Asian markets declined to end the September quarter over concerns in the Chinese property sector and wider Chinese economy. While data release towards the end of September indicated that Beijing’s policy stimulus provided more support than anticipated, markets aren’t holding their breath for a rebound anytime soon. The Hong Kong, Taiwan and South Korean markets dragged lower, while the Japanese equity market was a notable exception, returning a modest 2.5% higher over the quarter, driven by robust small-cap performance. Wider emerging markets also largely ended lower, caught in between a strong US economy on the one hand (raising concerns rates will stay elevated) and the potential for prolonged ongoing weakness in the Chinese economy on the other.
Global Bond Yields Lift-Off: Led by the US, global government bond yields peaked in September before retreating ever so slightly to end the month. While the quarter began with optimism that central banks have manged to orchestrate a ‘soft landing’ for the economy, enthusiasm withered as the months went on as it became clear that interest rates were set to remain elevated for longer than hoped. The September quarter saw a 76 bp lift in the US 10-Year, and a notable 45bp increase in Germany’s 10-Year, although the UK managed to buck the trend and mostly remain unchanged over the period. Overall, this saw the Bloomberg Global Aggregate Bond Index (hedged to NZD) return -1.7% amid a rising USD.
Key updates for the Kiwi investor:
New Zealand share market continues to struggle: The S&P/NZX 50 fell -1.9% over the month, as concerns rose about whether the Reserve Bank of New Zealand (‘RBNZ’) still has more rate hikes up their sleeve, following stronger than anticipated economic GDP data. This compared more favourably relative to our Trans-Tasman colleagues, where the S&P/ASX 200 benchmark index fell -2.8% over the month as inflation in Australia ticked higher to 5.2% year-on-year, while their economy grew a robust 2.1%.
Local bonds were also negative: NZ bond yields followed their global counterparts higher, with the local NZ 10-Year Government Bond Yield crossing the 5% threshold for the first time in 12 years, ascending 43 bp over the month and finishing at 5.32%. The market reacted to the potential for a higher path following upside surprises to NZ’s economic growth over the quarter above and beyond the RBNZ’s forecast. Overall, this saw the Bloomberg NZ Bond Composite 0+ Yr Index return -1.4% in September, as higher yields mean lower bond prices, which drag on total returns.
No more recession for NZ – but we’re not out of the woods yet: Grant Robertson announced in September that the NZ economy was on the mend, with a revised March quarter GDP figure showing NZ never entered a technical recession, while the June quarter GDP figure outlined growth of 0.9%, for an annual growth rate of 3.2%. The Q2 growth figure compared favourably against the OECD average of 0.5% and brought the NZ economy 7.7% larger than it was pre-pandemic. With such robust growth figures, why are some market commentators so wary that we’ve yet to turn the corner?
Economic conditions remain tough for many Kiwis: While New Zealand, like many countries worldwide have been able to avoid a recession, there is no doubt that economic conditions and the cost of living crisis continue to plague many Kiwis. The impact of rising interest rates often has a lag before it is fully reflected in the economy, as consumers take time to re-fix mortgages and adjust their spending accordingly. Kiwis that fixed their mortgages during the Covid-era lows are facing mortgage re-fixes at levels they were stress tested by their banks at.
With economic data, the devil is in the details: Despite overall GDP figures growing, for many individual Kiwis in the real world, it still feels like a recession. For if we dig into the details, we can see that the main contributors to GDP growth were led by business services and expenditure, while retail trade, accommodation and restaurants – or spending from the average Kiwi – were all down.
Positive data doesn’t necessary mean positive markets – Data releases are helpful indicators of where the economy is heading, but they aren’t the end-all be-all of how markets will perform. Avoid assuming that positive economic news means going all-in on markets to squeeze out the most return, and vice-versa in looking to avoid markets when economic headlines are less forthcoming, as markets can often have counterintuitive reactions to positive or negative news.
Focus on building consistent investing habits, rather than solely reacting to economic headlines: Many investors will be well-served by focusing on building towards their long-term investment goals, rather than pursuing the first gut-reaction that headlines attempt to garner. Empirical evidence shows that developing a good habit of investing what you can and doing so regularly, is a great way to build long-term wealth.
Chart of the month:
Harbour Asset Management highlights current market trends have deviated away from the traditional inverse relationship between real bond yields and share market valuations.
Our Chart of the Month is from Harbour Asset Management with data from Bloomberg, which outlines the relationship between the US 10-Year Real Bond Yields (yields less inflation) and the Forward P/E ratio (or ratio of current share price to forecasted earnings) of the MSCI All Country World Index.
In general, bond yields and stock valuations have an inverse relationship: As bond yields increase then shares decrease and vice-versa. This is because as real bond yields increase, shares become less attractive as investors can earn a higher level of returns (relatively speaking) through much safer bonds, rather than rolling the dice on the much-riskier equities. Rising bond yields thus provides a drag on equity demand, so the price of shares will go down, which brings the P/E ratio down with it as the ‘P’ numerator decreases.
Harbour notes however that the traditional bond-equity dynamic has yet to hold in 2023: The red dot represents the bond yield-equity value relationship from a year ago. Fast forward to present day though in the yellow dot and while real yields have increased, so too have share market valuations. Harbour points out that this highlights potential over exuberance in market valuations, with scope for a lower re-pricing of shares. Harbour is thus currently defensive positioned (underweight equities or holding less shares than the benchmark) within their Active Growth Fund.
This highlights the potential validity of different investing styles – active management through experienced investment firms like Harbour, Milford and Fisher Funds can play a valuable role in adding value to a fund by incorporating well-research market insights into portfolio positioning. Equally though, following a passive or index-tracking approach to investing is also valid if you were say more fee conscious.
You don’t have to stick with just one investing approach! Different investing styles can be complementary – you could construct a primarily passive approach to save on fees, whilst also having active components to provide potential portfolio outperformance by leveraging the insights of professional managers. Combining different investing approaches is a common way that many institutional asset owners like the NZ Super Fund or ACC invest to great success. With InvestNow’s wide range of fund options across the spectrum of investing styles, tailoring an investment portfolio to your specific needs is super easy to do for all Kiwi investors.
What we’ve been reading:
- Antipodes: Why you need exposure to British stocks
- Devon Funds: Responsible Investment Leader
- Fisher Funds: Buying the dip, explained
- Harbour: The Future of Wealth
- Morningstar: Want to beat the market? Embrace the power of ‘buy and hold’ investing
- MJW: KiwiSaver Market Review
- Nikko: Dire economic outlook should be positive for bonds
- RIAA: Responsible Investment Benchmark Report Aotearoa New Zealand 2023
- Russell Investments: The hidden costs of investing: The tax iceberg
- Salt: Regional Hedge Fund awards put Salt in the mix